1. Executive Summary
Traditional equity research focuses heavily on balance sheets, P/E ratios, and technical price action. However, a company’s true resilience often lies hidden in its upstream and downstream network. Supply Chain Risk Analysis is the systematic evaluation of a company’s suppliers, buyers, and logistical partners to identify vulnerabilities that financial statements cannot capture.
The Stock360s Supply Chain Intelligence platform transforms raw supplier data into a quantified risk intelligence model. By mapping network topology, calculating Herfindahl-style dependency concentration, and simulating shock propagation, Stock360s provides investors with a forward-looking view of operational fragility, geographic exposure, and hidden counterparty risks.
2. Key Takeaways
- Financials lag reality: A company can report record profits while sitting on a fragile, single-source supply chain that is one disruption away from collapse.
- Structural Risk (SPOF): Relying on a single Tier-1 supplier creates a Single Point of Failure, mathematically quantified by Stock360s as a critical structural risk.
- Dependency Concentration: Using a Herfindahl-Hirschman Index (HHI) approach, the platform measures how over-reliant a company is on a few key vendors.
- Shock Propagation: Network centrality algorithms identify which supplier failure would cause the most catastrophic ripple effects across the entire ecosystem.
- Smart Money Flow: Lead-lag correlation analysis reveals when a supplier’s stock price movement can predict the core company’s future stock performance.
3. What Is Supply Chain Risk Analysis for Stocks?
Supply chain risk analysis for stocks is the process of mapping and quantifying the operational dependencies between a publicly traded company and its network of suppliers, manufacturers, logistics providers, and buyers.
Unlike traditional fundamental analysis, which looks at a company in isolation, supply chain analysis treats the company as a node in a complex network. It answers critical questions:
- What happens if a key supplier in a geopolitically unstable region goes offline?
- Is the company’s growth dependent on a single buyer who could demand aggressive price cuts?
- How quickly would a raw material shortage propagate to the company’s revenue?
By answering these questions, investors can avoid "value traps"—stocks that appear cheap based on earnings but carry existential operational risks.
4. Why It Matters
Modern supply chains are global, multi-tiered, and highly optimized for cost—often at the expense of resilience. The semiconductor shortage, the Suez Canal blockage, and regional geopolitical conflicts have proven that operational fragility translates directly to stock price volatility.
The Hidden Cost of Opacity
Most investors only see Tier-1 suppliers. They miss Tier-2 and Tier-3 dependencies. If a Tier-2 supplier in a high-risk geography faces a regulatory shutdown, the Tier-1 supplier cannot deliver, and the core company misses earnings guidance. Stock360s brings this indirect exposure to light.
5. How It Works: Stock360s Supply Chain Intelligence
The Stock360s Supply Chain tab converts raw relational data from pre-processed databases (company_supply_chain, stock_dependence, company_order_book) into an interactive risk intelligence dashboard.
The system processes data through three core layers:
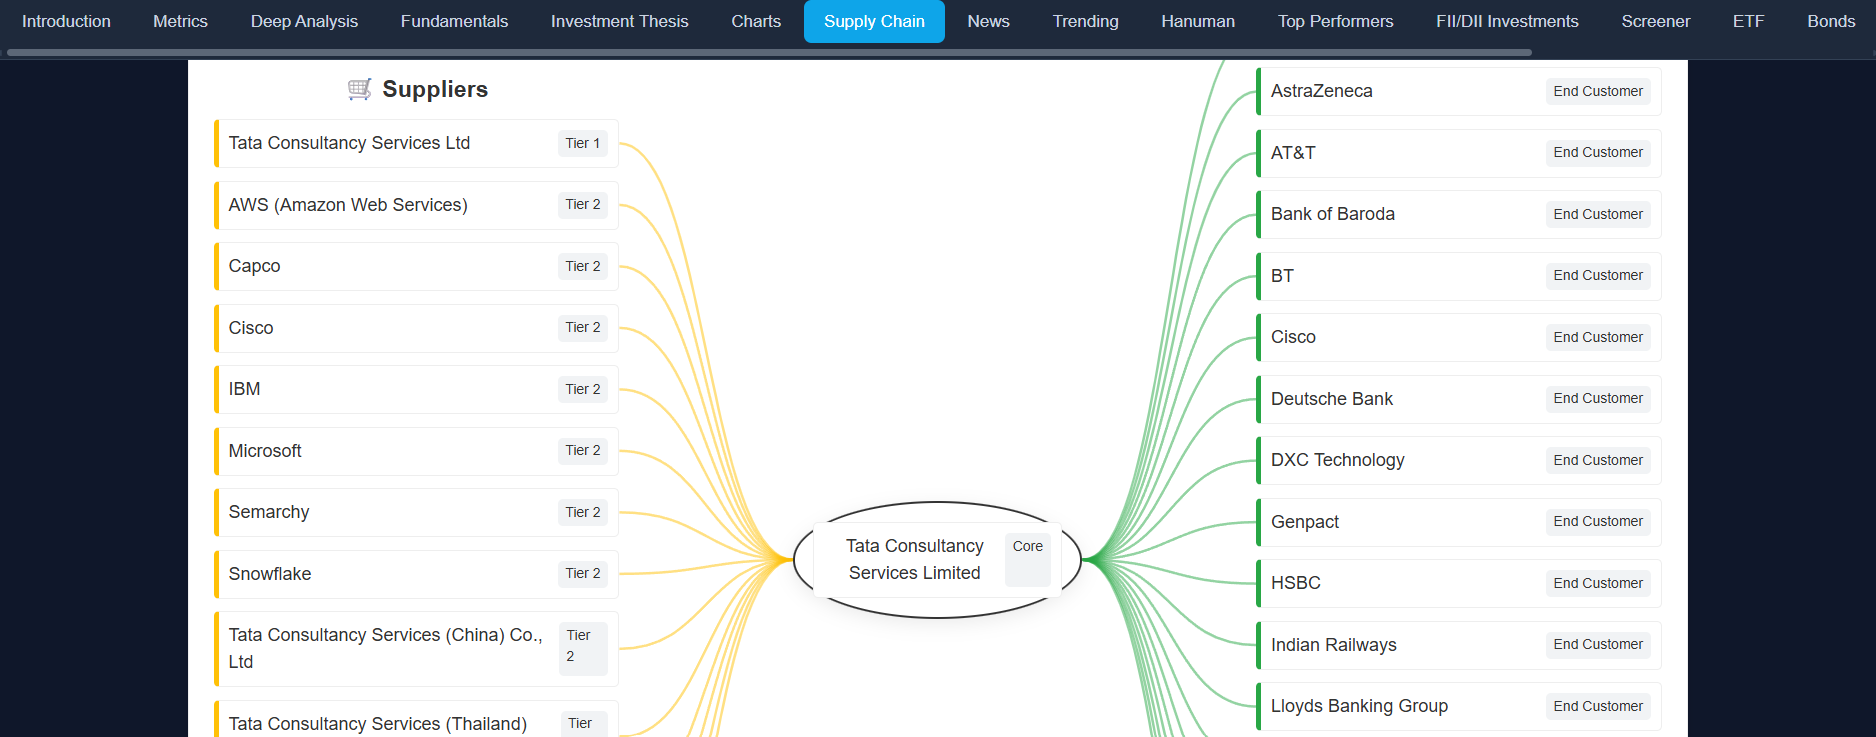
- Network Mapping: Visualizes the three-column flow (Suppliers → Core Company → Buyers) with expandable entity cards showing tier levels, contract values, and geographic locations.
- Risk Quantification: Applies proprietary mathematical models to calculate structural fragility, financial concentration, and data opacity.
- Predictive Signaling: Integrates market data to correlate supplier stock movements with the core company, generating Smart Money Flow signals.
6. Methodology: The 6 Pillars of Risk Scoring
Stock360s does not rely on static ratings. The Supply Chain Risk Index (0–100) is a dynamic, weighted composite derived from six distinct methodological pillars.
🧱 Pillar 1: Structural Risk (Single Point of Failure)
Measures the fragility of the supply chain based on the count of direct (Tier-1) suppliers. Fewer Tier-1 suppliers indicate higher dependency.
Tier-1 Count = 2 → Score = 60
Tier-1 Count < 5 → Score = 40
Tier-1 Count ≥ 5 → Score = 20 (Resilient)
💰 Pillar 2: Dependency Concentration (Herfindahl-Style)
Measures financial over-reliance on a few vendors. If normalized dependency data is missing, the system uses intelligent fallback heuristics (Tier 1 = 0.5, Tier 2 = 0.2, Other = 0.05).
Dependency Score = MIN( SUM(Sharei²) / 50 , 100 )
👁️ Pillar 3: Visibility Risk (Data Opacity)
Quantifies the risk of missing data. If contract end dates and financial values are undisclosed, uncertainty increases.
Visibility Risk Score = (1 - Visibility Ratio) * 100
⚠️ Pillar 4: Entity-Level Risk Scoring
Each supplier is evaluated individually using a network-aware model combining tier importance, geographic exposure, contract status, propagation dynamics, and network centrality.
+ Geo Risk: +15 if located outside INDIA, USA, GERMANY, JAPAN
+ Contract Risk: +10 if contract_end_date is missing
+ Propagation: + MIN(Propagation Score * 0.3, 30)
+ Centrality: + MIN(Centrality Score * 100 * 0.2, 20)
Final Entity Risk = MIN(Total, 100)
🧮 Pillar 5: Composite Risk Index
The final 0–100 score is a weighted average ensuring both structural fragility and real-world disruption impacts are captured.
Categories: ≥75 (Critical), ≥50 (High), ≥25 (Medium), <25 (Low)
📊 Pillar 6: Confidence Score
Ensures users know if the risk score is data-driven or heuristic. It combines the availability of financial dependency data and contract visibility.
Labels: >0.8 (High Certainty), >0.5 (Moderate), >0.2 (Estimating), ≤0.2 (Low/Heuristic)
7. Data Sources
Stock360s aggregates and normalizes data from multiple institutional-grade sources to build the supply chain graph:
- company_supply_chain: Contains tier levels, normalized dependency values, contract dates, and geographic locations of suppliers and buyers.
- stock_dependence: Tracks historical price correlations, lead-lag analysis, and predictive scores between supplier stocks and the core company.
- company_order_book: Provides recent regulatory filings for confirmed purchase orders, contract values (in ₹ Crores), and partner durations.
- Network Graph Metrics: Pre-computed centrality and propagation scores derived from graph theory algorithms applied to the supply chain topology.
8. Practical Examples
Example A: The Auto Manufacturer (High Structural Risk)
An Indian auto OEM sources 80% of its specialized microcontrollers from a single Tier-1 supplier in East Asia. Stock360s flags this with a Structural Risk of 90 and a high Geographic Risk. When a regional port strike occurs, the OEM halts production. Investors using Stock360s saw the risk index spike months before the earnings miss.
Example B: The IT Services Giant (Low Risk, High Visibility)
A large IT firm has hundreds of Tier-1 hardware and software vendors globally. The Dependency Score is low (15) because spend is diversified. However, the Visibility Risk is high (60) because many sub-vendor contracts are undisclosed. The system correctly labels the confidence as "Estimating," prompting analysts to dig deeper into sub-contractor stability.
9. Benefits of Supply Chain Intelligence
- Early Warning System: Detect hidden operational risks before they impact quarterly earnings.
- Portfolio Hedging: Avoid over-concentrating your portfolio in companies that share the same fragile Tier-2 suppliers.
- Trading Alpha: Use Smart Money Flow signals to trade the core stock based on the leading indicator of its key suppliers.
- Due Diligence: Validate management claims about "diversified supply chains" with hard mathematical proof.
11. Common Mistakes Investors Make
- Ignoring the Confidence Score: A "Critical" risk score with a "Low (Heuristic)" confidence label means the data is incomplete, not necessarily that the company is doomed. Always cross-reference with the confidence badge.
- Focusing Only on Tier-1: Tier-2 and Tier-3 suppliers often hold the real monopoly power in specialized raw materials. Use the Shock Simulation to find hidden nodes.
- Misinterpreting Propagation Score: A high propagation score doesn't mean a supplier is financially unstable; it means if they do fail, the impact on the core company will be massive.
12. Use Cases
- Equity Long/Short Funds: Shorting companies with high SPOF risk and low visibility ahead of earnings seasons.
- Credit Analysts: Assessing the likelihood of supply chain disruptions affecting a corporate bond issuer's cash flows.
- Corporate Strategists: Benchmarking their own supply chain resilience against industry peers using the Industry Dependency Check.
13. Industry Applications
| Industry | Primary Supply Chain Risk | Stock360s Feature Used |
|---|---|---|
| Automobile | Semiconductor & Battery Cell Concentration | Dependency Score, Geo-Risk Flag |
| Pharmaceuticals | API (Active Pharmaceutical Ingredient) Sourcing | Structural Risk, Hidden Risks Panel |
| FMCG | Agricultural Raw Material Volatility | Order Book, Supplier Signal vs Stock |
| Capital Goods | Specialized Steel & Electronics Imports | Shock Simulation, Centrality Score |
14. Comparison: Traditional Analysis vs. Stock360s
| Feature | Traditional Fundamental Analysis | Stock360s Supply Chain Intelligence |
|---|---|---|
| Supplier Visibility | Manual reading of annual reports | Automated network graph with Tier 1-3 mapping |
| Risk Quantification | Qualitative management commentary | Mathematical Risk Index (0-100) with Confidence Score |
| Concentration | Top 5 customer/supplier % disclosure | Herfindahl-style continuous dependency scoring |
| Shock Impact | Not analyzed | Propagation Score & Network Centrality simulation |
| Market Signals | Not integrated | Smart Money Flow (Lead-Lag Correlation) |
15. Related Concepts
- Counterparty Risk: The risk that a supplier or buyer defaults on their obligations.
- Lead-Lag Correlation: A statistical measure of how one time series (supplier stock) tends to move before another (core stock).
- Network Centrality: A graph theory metric identifying the most critical nodes in a supply chain ecosystem.
- Just-in-Time (JIT) Vulnerability: The increased risk of disruption when companies minimize inventory buffers.
16. How Stock360s Helps (Product-Led Intelligence)
Stock360s bridges the gap between abstract supply chain theory and actionable equity research.
- Data Collection: We ingest and normalize structured data from regulatory filings, order books, and financial dependencies into a unified relational schema.
- Processing: Our backend applies graph theory for centrality, Herfindahl mathematics for concentration, and statistical models for lead-lag market signals.
- Visualization: The frontend renders an interactive SVG network flow, a quadrant-based Supplier Risk Matrix, and intuitive risk gauges.
- User Benefit: You stop guessing about operational resilience. You get a mathematically proven, visually intuitive map of exactly what could break a stock—and what stocks might predict its next move.
17. Step-by-Step Usage Guide
- Navigate to a Stock: Open any Indian stock detail page (e.g., Tata Motors) and select the Supply Chain tab.
- Assess the Dashboard: Look at the Risk Index Gauge. Is it Critical (≥75)? Check the Confidence Badge to ensure the data is reliable.
- Inspect the Matrix: Hover over the Supplier Risk Matrix. Any dots in the top-right "Critical" quadrant require immediate attention.
- Run Shock Simulation: Open the If Supplier Fails panel. Identify the entity with the highest Propagation Score.
- Check Hidden Risks: Review the Hidden Risks card for suppliers flagged with high geographic exposure.
- Leverage Smart Money Flow: Look at the Supplier Signal vs Stock panel. If a key supplier has a high predictive score and bullish bias, monitor it as a leading indicator.
18. Frequently Asked Questions (50 FAQs)
🔴 Critical Questions
1. What is supply chain risk analysis for stocks?
It is the process of evaluating a company's upstream and downstream network to identify vulnerabilities like supplier dependency, geographic exposure, and operational fragility that could impact financial performance and stock price.
2. How does Stock360s calculate the Supply Chain Risk Index?
The index is a weighted average: Structural Risk (40%), Dependency Concentration (30%), Visibility Risk (15%), and Average Entity Risk (15%). It ranges from 0 to 100.
3. What is a Single Point of Failure (SPOF) in a supply chain?
A SPOF occurs when a company relies on a single Tier-1 supplier for critical components. If that supplier fails, the company's operations halt completely.
4. Why does having only one Tier-1 supplier increase risk?
It eliminates redundancy. Stock360s assigns a Structural Risk score of 90 to companies with only one Tier-1 supplier, indicating extreme vulnerability to disruptions.
5. What is the Herfindahl-style dependency score?
It measures financial concentration by summing the squared market shares of suppliers. A higher score indicates over-reliance on a few vendors, similar to the Herfindahl-Hirschman Index used in economics.
6. How is the Confidence Score calculated?
It combines the availability of financial dependency data (60% weight) and contract visibility (40% weight). It tells you if the risk score is based on hard data or estimates.
7. What does the Supplier Risk Matrix show?
It plots suppliers on a scatter plot: X-axis is financial dependency, Y-axis is operational risk. It helps identify "Critical" suppliers (high spend, high risk).
8. What is the Propagation Score?
It measures how far and wide a shock from a specific supplier would spread across the network. A high score means that supplier's failure would severely impact the core company.
9. How does Stock360s detect hidden geographic risks?
It flags suppliers located outside stable regions (INDIA, USA, GERMANY, JAPAN) and combines this with their dependency level to calculate an Indirect Exposure Score.
10. What is Smart Money Flow in the context of supply chains?
It refers to predictive signals derived from the lead-lag correlation between a supplier's stock price and the core company's stock price, helping traders anticipate movements.
🟠 High Priority Questions
11. What is the difference between Tier-1 and Tier-2 suppliers?
Tier-1 suppliers deliver directly to the core company. Tier-2 suppliers deliver to the Tier-1 suppliers. Risks in Tier-2 are often hidden but can cascade upward.
12. How does visibility risk affect the overall risk score?
Low visibility (missing contract dates or financial data) increases the Visibility Risk Score, which contributes 15% to the final Risk Index, reflecting higher uncertainty.
13. What is the Business Stability Score?
It is derived from the supply chain DNA (fingerprint), evaluating concentration, geographic diversity, and overall resilience to rate the network as Strong, Moderate, or Weak.
14. How often is the supply chain data updated?
Order book and dependency data are updated periodically from regulatory filings and company announcements, typically on a daily or weekly basis.
15. Can I analyze supply chain risk for US stocks?
Currently, the deep-tier supply chain database is optimized for Indian stocks (IN market). Support for US markets is planned for future releases.
16. What does the Order Book section reveal?
It shows recent confirmed purchase orders, contract values (in ₹ Crores), partner names, and durations, indicating future revenue visibility and partner dependencies.
17. How do I interpret the Fragility (SPOF) bar?
It shows the structural risk based on Tier-1 count. A full bar means high fragility (e.g., only 1 Tier-1 supplier), while a low bar indicates a diversified supplier base.
18. What is the Opacity (No Data) bar?
It represents the Visibility Risk. A high opacity bar means many suppliers lack disclosed contract end dates or financial values, increasing uncertainty.
19. How does geographic diversification reduce supply chain risk?
Sourcing from multiple stable countries prevents a single regional event (e.g., natural disaster, trade ban) from halting the entire supply chain.
20. What is the Industry Dependency Check?
It compares a company's supply chain metrics (supplier count, foreign ratio, critical nodes) against sector-level averages to highlight relative strengths or weaknesses.
🟡 Medium Priority Questions
21. What is centrality score in supply chain networks?
A graph theory metric that identifies how critical a specific supplier is to the overall network connectivity. High centrality means the node is a vital bridge.
22. How does Stock360s handle missing financial dependency data?
It uses intelligent fallback heuristics based on tier levels (Tier 1 = 0.5, Tier 2 = 0.2, Other = 0.05) to estimate dependency shares for the Herfindahl calculation.
23. What are the four quadrants of the Supplier Risk Matrix?
Critical (High Spend, High Risk), Strategic (High Spend, Low Risk), Vulnerable (Low Spend, High Risk), and Routine (Low Spend, Low Risk).
24. How can I use Smart Money Flow signals for trading?
If a supplier stock has a high predictive score and consistent directional bias, you can monitor its price action as an early indicator for the core stock's movement.
25. What is an indirect exposure score?
A score that combines a supplier's geographic risk flag with their dependency level to quantify hidden risks not immediately obvious from tier levels alone.
26. Does the model account for cyber risks or labor disputes?
Not directly. The model focuses on structural, financial, and geographic risks. However, a supplier in a region prone to labor disputes may be flagged via geographic risk factors.
27. How is the final risk category determined?
≥75 is Critical, ≥50 is High, ≥25 is Medium, and <25 is Low. These thresholds help investors quickly prioritize which stocks need deeper due diligence.
28. What is supply chain DNA or fingerprint?
A JSON object containing structural metrics like tier1_concentration, geo_diversity, avg_depth, and resilience_score that defines the unique topology of the network.
29. How does shock simulation work?
It ranks suppliers by their Propagation Score, showing you exactly which entity's failure would cause the maximum cascading impact on the core company's operations.
30. Can I compare supply chain risk between two competitors?
Yes, by opening the Supply Chain tab for two different stocks in the same sector, you can compare their Risk Indices, Structural Risk, and Dependency Scores side-by-side.
31. What is lead-lag correlation in supplier stocks?
A statistical measure showing that the supplier's stock price tends to move in a predictable direction a certain number of days before the core company's stock moves.
32. How do contract end dates impact risk analysis?
Missing contract end dates increase the Visibility Risk Score. Short-term contracts indicate higher renewal risk compared to long-term, locked-in agreements.
33. What is the difference between operational risk and financial dependency?
Operational risk relates to the supplier's ability to deliver (geo-risk, tier, centrality). Financial dependency relates to how much of the core company's spend is tied to that supplier.
34. How does Stock360s visualize the supply chain network?
It uses an interactive SVG three-column flow diagram with dynamic connector lines that redraw on resize, allowing users to expand/collapse entity details seamlessly.
35. What happens if a supplier's stock price drops significantly?
It may indicate financial distress. Stock360s' Smart Money Flow panel will show the correlation and directional bias, alerting you to potential counterparty risk.
🟢 Low Priority / Niche Questions
36. Is the supply chain data based on real-time API feeds?
No, it is based on pre-processed databases updated from regulatory filings and structured data extracts to ensure accuracy and historical consistency.
37. Can I export the supply chain risk report?
Export functionality for the deep-tier network graph is part of the institutional data API suite. Contact the Stock360s team for enterprise access.
38. How are logistics providers classified in the model?
They are classified under the "Logistics" tier level, which is treated as a supplier node but typically carries different weight in dependency calculations than raw material providers.
39. What is the role of distributors in the supply chain flow?
Distributors are classified as "Buyers" on the right side of the flow diagram. High concentration among distributors indicates customer-side revenue risk.
40. How does the model treat end customers?
End Customers are also classified as Buyers. If a company sells directly to consumers, this node represents the final demand side of the network.
41. What is the significance of the network flow diagram?
It provides an immediate visual understanding of the company's market position, showing the breadth of upstream inputs and downstream revenue channels.
42. How does Stock360s define a "critical node"?
A critical node is a supplier with high centrality and high propagation scores, meaning the network topology relies heavily on this specific entity for connectivity.
43. Can supply chain risk analysis predict stock price crashes?
While not a crystal ball, it identifies structural fragilities that, when triggered by real-world events, often lead to severe earnings misses and subsequent stock price declines.
44. What is the difference between structural risk and dependency risk?
Structural risk is about the count of Tier-1 suppliers (SPOF). Dependency risk is about the financial concentration of spend among those suppliers (Herfindahl index).
45. How does the system identify second-order dependencies?
Through the network graph depth and centrality metrics, which map how Tier-2 suppliers connect to Tier-1, allowing the system to infer indirect exposure.
46. What is the impact of geopolitical events on the risk score?
Geopolitical instability in a supplier's country increases the Geographic Risk component (+15 points) of the Entity Risk Score, elevating the overall risk profile.
47. How are normalized dependency values derived?
They are derived from disclosed financial data regarding the percentage of total procurement spend or operational reliance attributed to a specific supplier.
48. What is the threshold for a high geographic risk flag?
The system flags suppliers as high-risk if their location_country is not in the stable list: INDIA, USA, GERMANY, JAPAN, based on historical economic and political stability indices.
49. How does the confidence label help?
It prevents false confidence. A "Critical" risk score with an "Estimating" label tells you the model is using heuristics due to missing data, so you should treat the score as directional.
50. Where can I find the methodology documentation?
The mathematical formulas, weighting logic, and data source disclosures are detailed in the Methodology section of this page and the Stock360s Research documentation portal.
19. Glossary
A supplier whose failure would cause the entire chain to stop. Quantified by Stock360s Structural Risk.
Measure of how disruptive a supplier's failure would be to the core company (0-100).
Graph-based measure of how important a node is within the supply chain network topology.
A 0-1 value representing the proportion of the company's spend or operational reliance on a given supplier.
A concentration metric (sum of squared shares) used to quantify over-reliance on few suppliers.
Risk arising from missing data (e.g., no contract end date). Higher opacity means less visibility.
Predictive signal derived from the correlation and lead-lag relationship between supplier and core stock.
Indicator of a supplier's location risk: LOW, MEDIUM, HIGH (based on country stability indices).
A score that combines geo-risk with dependency level to quantify hidden Tier-2/Tier-3 risks.
List of confirmed purchase orders or contracts, indicating future revenue or supply commitments.
Statistical measure showing one time series (supplier stock) moving before another (core stock).
The risk that a supplier or buyer fails to meet its contractual or financial obligations.
20. References & Trust Signals
- Author: Shailendra Saurav, Financial Researcher at Stock360s.
- Review & Approval: Peer-reviewed and approved by the Stock360s Research Team.
- Data Sources: Aggregated from regulatory filings (BSE/NSE), corporate order book announcements, and institutional supply chain databases.
- Methodology Transparency: All risk scoring formulas (Herfindahl, Structural, Visibility) are disclosed in Section 6 of this document.
- Risk Disclosure: Supply chain analysis is a tool for due diligence. It does not constitute financial advice. All investments carry market risks.
21. Conclusion
Financial data shows what a company has done. Supply chain analysis shows what could break it.
By moving beyond static balance sheets and embracing network-level risk modeling, investors can uncover the hidden operational fragilities that traditional analysis misses. Stock360s Supply Chain Intelligence provides the mathematical rigor, visual clarity, and predictive signaling required to navigate today's complex global markets.
👉 This is not just data — it is operational risk intelligence.