Trading morning · sample
- F&OTechnical position of every name
- HistoryWhat followed when it stayed there
- StrategyEligible for top-performer setups
- DataThe series behind each line
- FileOne PDF, before 8:50 AM
Allocation, yield and concentration in a single view — stocks, ETFs, mutual funds and bonds on one desk.
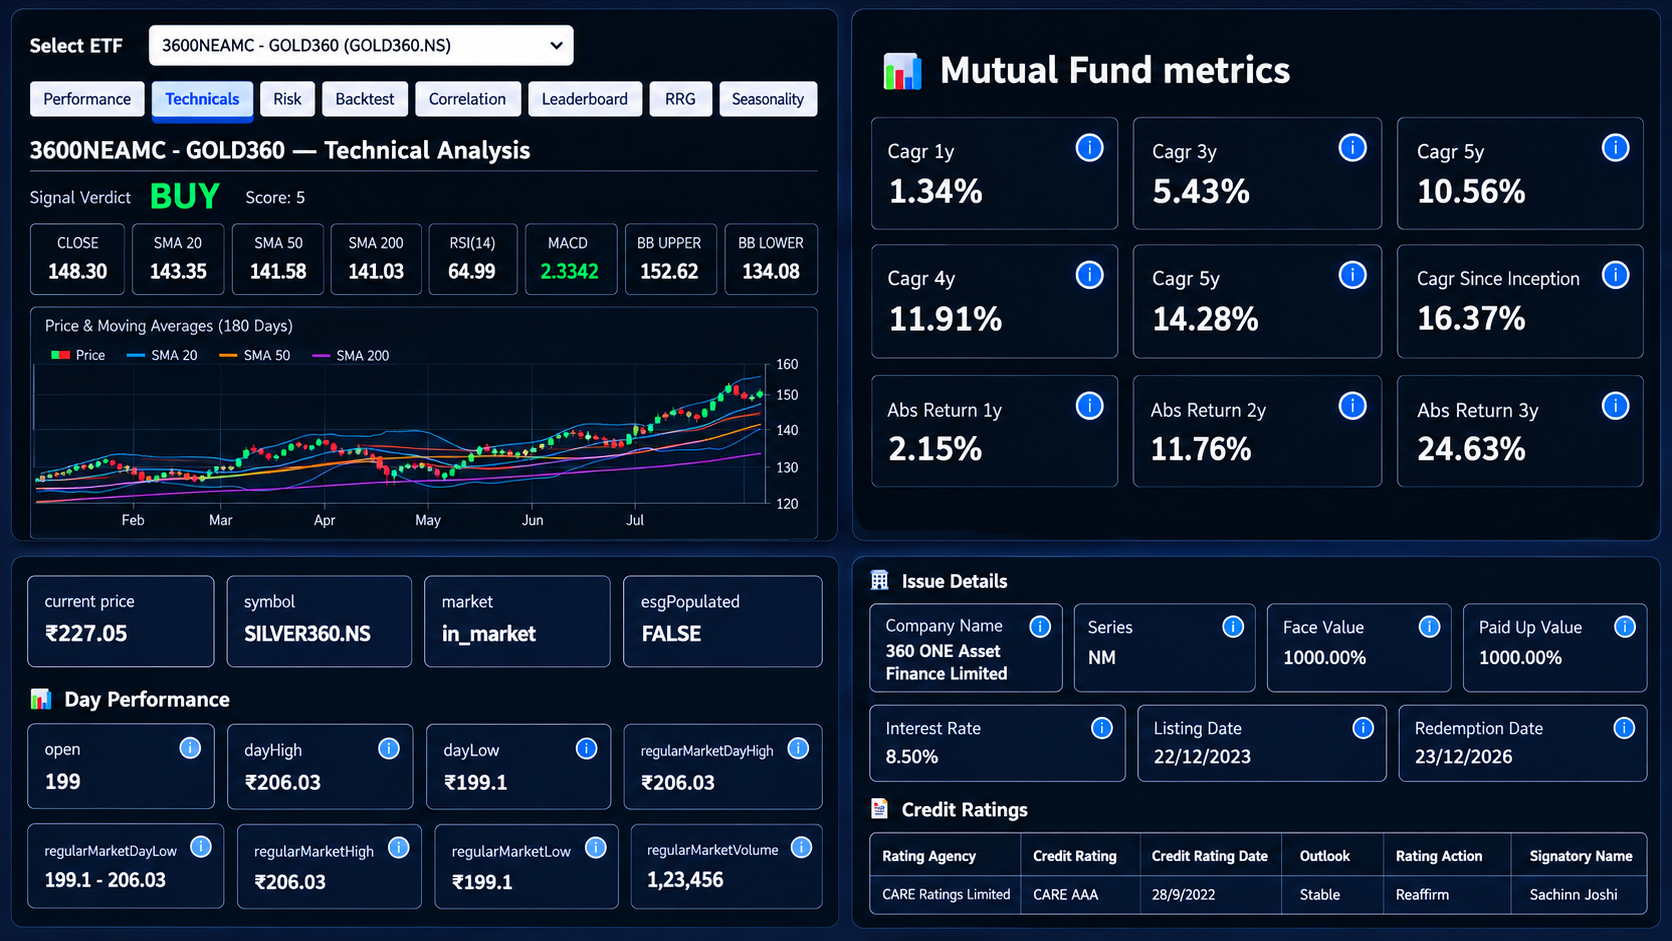
Business, flow and the chart — one conviction score for every NSE & BSE listed company.
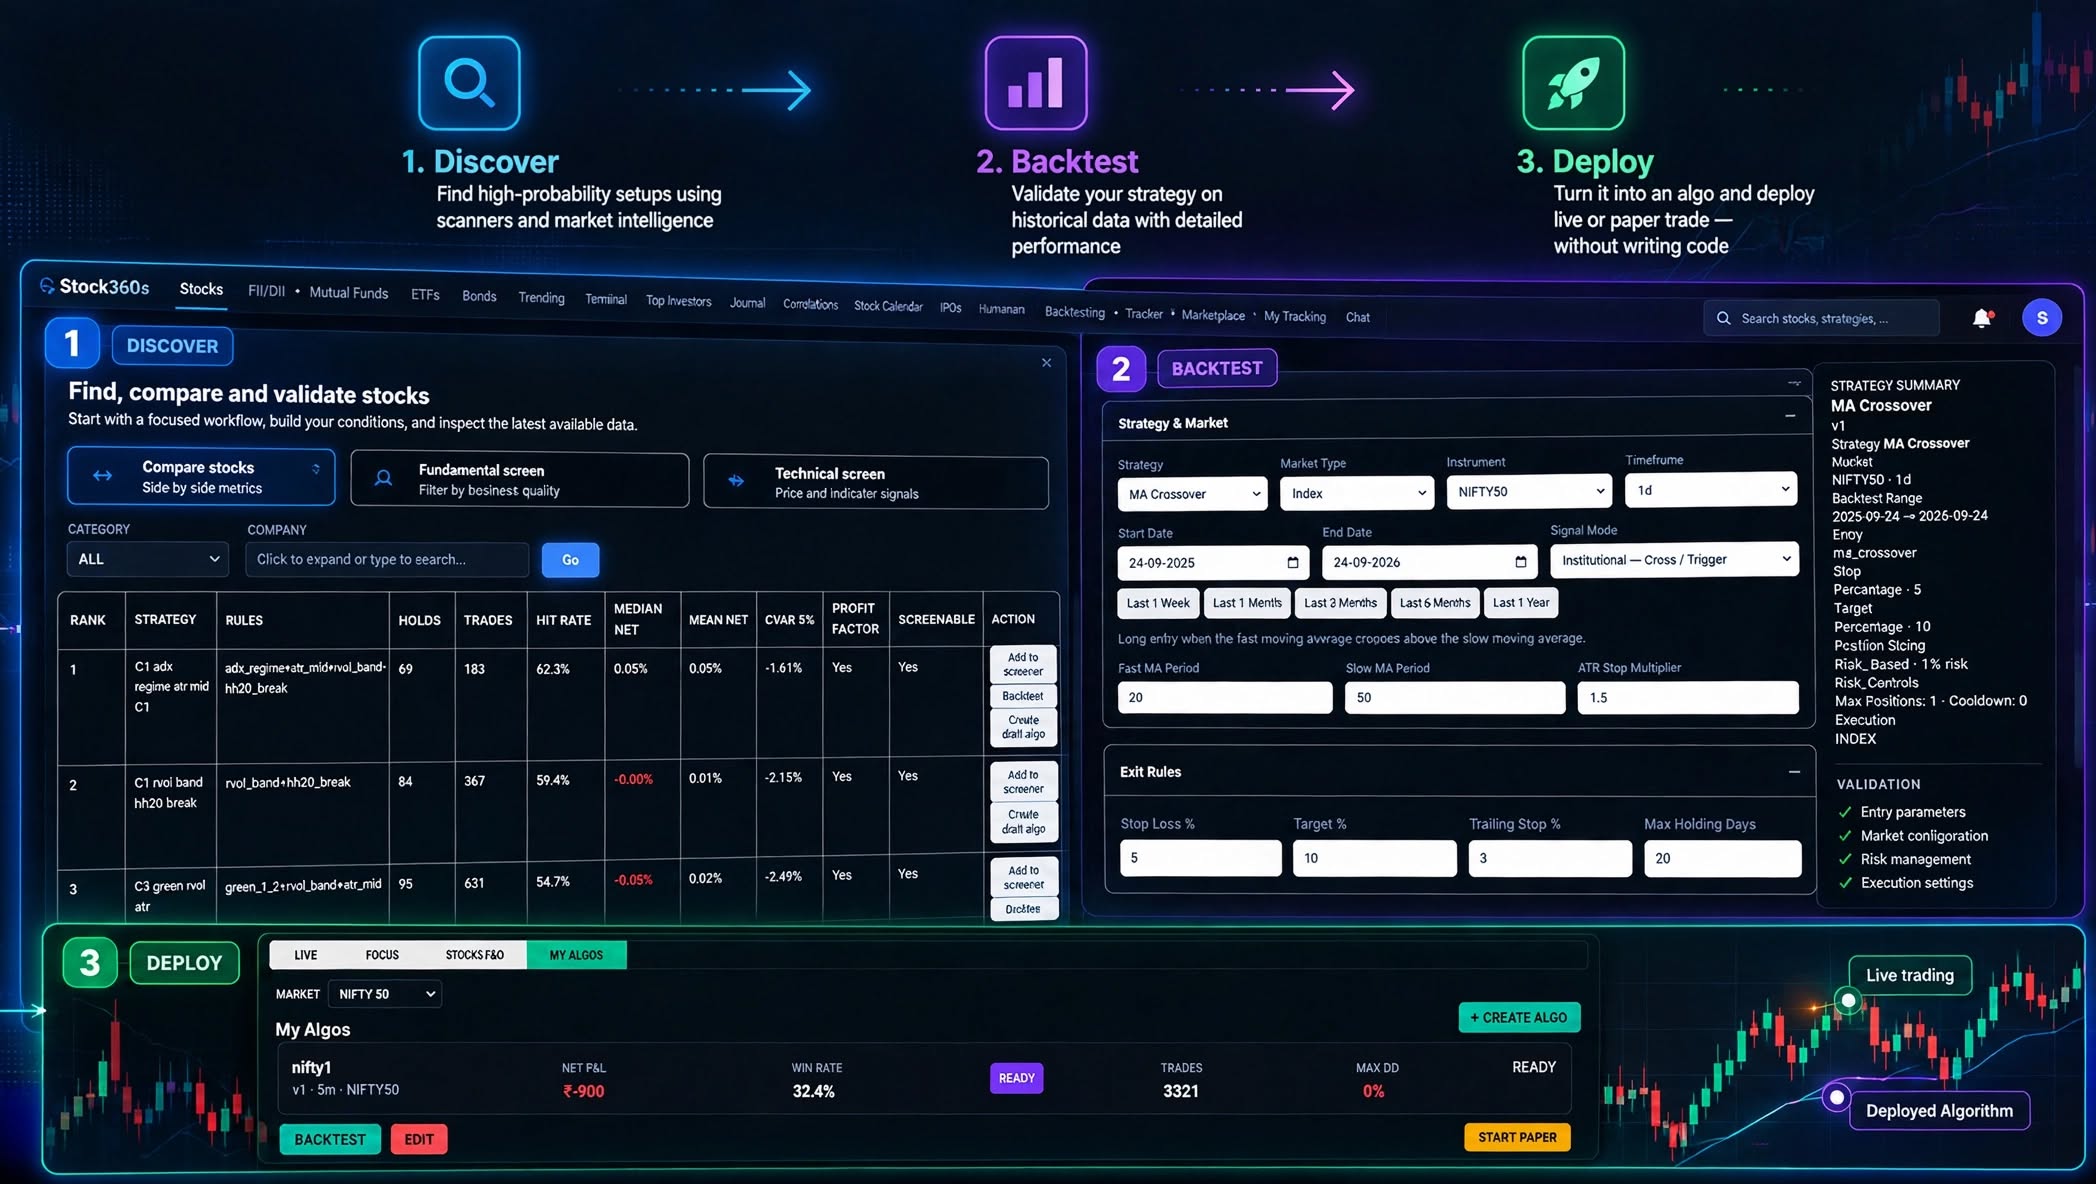
Find a strategy, validate it against historical market data, and deploy it to algo trading — without building the system yourself.
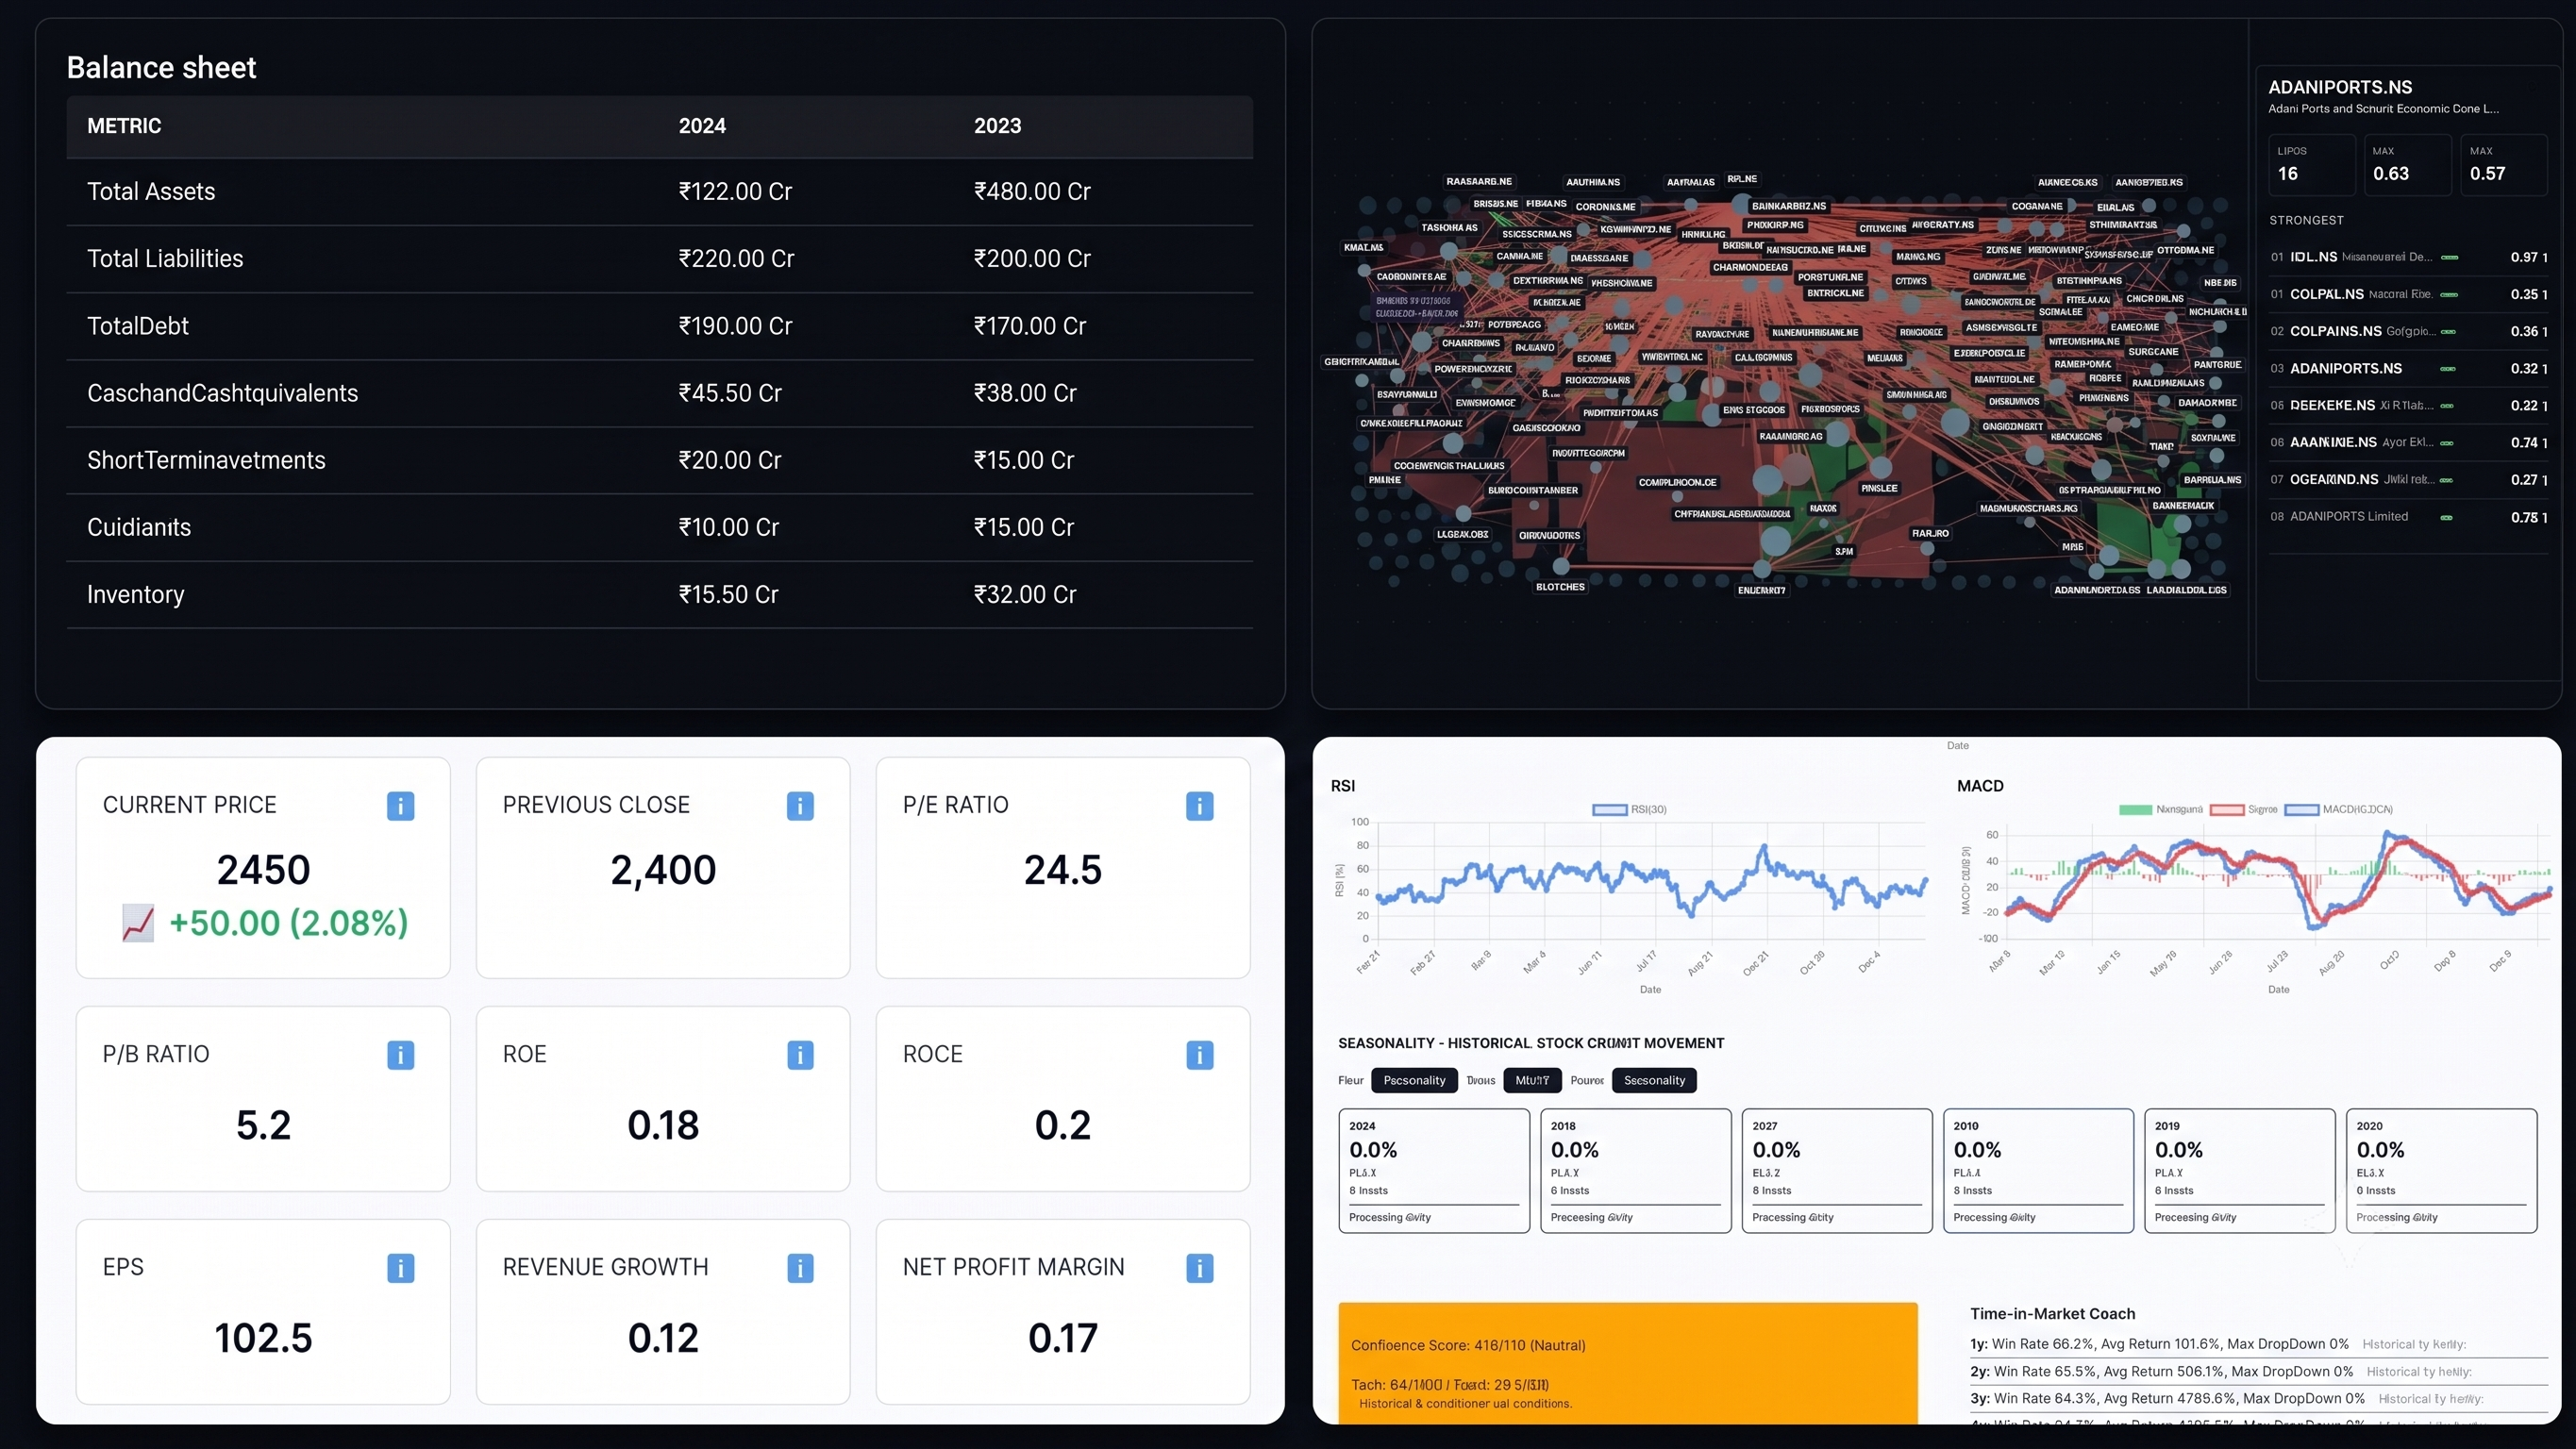
Move beyond stock-only thinking. Stock360s brings stocks, ETFs, mutual funds and bonds into a single research surface — with cross-asset correlation, yield comparison and risk modelling built in.
Compare 2,400+ schemes across 38 categories. Track AUM, expense ratio, rolling returns and manager conviction.
Nifty, Bank, Gold, Sectoral and Thematic ETFs with iNAV tracking, premium/discount signals and liquidity scores.
G-Secs, SDLs and corporate bonds with YTM, duration, modified duration and credit spread analytics.
Fundamentals, technicals and institutional flow for every NSE & BSE listed company, distilled into a single conviction score.
Most platforms show you a NAV chart and call it research. Stock360s shows you the portfolio beneath the fund — what the manager actually owns, how concentrated it is, how it correlates with the rest of your portfolio, and whether the expense ratio is justified by alpha generation.
An ETF is only as good as its liquidity. Stock360s tracks iNAV, premium/discount to NAV, average spread and impact cost — so you know whether the ETF you're buying will actually trade close to fair value when you need to exit. We also surface sectoral and thematic ETFs that match your existing portfolio gaps.
Bonds are where institutions park billions — and where most retail investors have zero visibility. Stock360s demystifies G-Secs, SDLs and corporate bonds with yield-to-maturity, duration, modified duration and credit spread analytics, so you can build a real fixed-income ladder instead of relying on FDs.
Track the holdings of India's most successful investors based on public shareholding data. See conviction, allocation changes and new entries before quarterly earnings season.
You may own 12 stocks across 5 sectors — but if 4 of them depend on the same supplier, the same crude price and the same dollar cycle, you don't have diversification. You have the illusion of it. Stock360s maps real correlation beneath the surface.
Your top 5 positions account for 68% of total portfolio value. Consider trimming concentration or adding uncorrelated assets.
Your holdings are not over-correlated. Adding gold or a sovereign bond ETF would further reduce drawdown risk.
The equity risk premium is below its 10Y average. Adding 10Y G-Secs at 7.02% would lock in yield while reducing portfolio volatility.
A complete research workflow for every NSE & BSE listed company — fundamentals, technicals, institutional flow and supply chain collapsed into a single conviction score so you can decide in minutes, not hours.
Most platforms dump 200 fundamental ratios on you and call it research. Stock360s surfaces the 12 metrics that institutional analysts actually use — ROCE, ROE, free cash flow yield, EV/EBITDA, promoter pledge, contingent liabilities — with 10Y history and peer benchmarking built in.
Candlesticks, indicators, multi-timeframe analysis and market structure — without the charting-software overwhelm. Stock360s highlights the three things that matter on any chart: trend direction, key levels and momentum confirmation, then translates them into a single readable signal.
FII and DII flow, bulk and block deals, sectoral rotation and promoter activity — tracked in near real-time and translated into a single institutional conviction score per stock and per sector.
Real-world events move stocks before they show up in financials. Container shipping rates, crude tanker routes, semiconductor supply, weather disruptions and regulatory changes — Stock360s tracks the supply chain signals that impact your stocks weeks before they hit quarterly earnings.
Supply chain signals suggest a 62% probability of a downside earnings surprise next quarter. Reduce position or hedge accordingly.
Pre-built institutional screens plus a fully custom screener. Filter by fundamentals, technicals, institutional flow, supply chain signals and conviction score — then save and alert on your screen so you never miss a fresh match.
Price. Structure. Liquidity. Order flow. Options. Confluence. Six layers of market intelligence, layered onto one canvas, telling a single story: where the market is actually going next.
Candles, EMA, VWAP, market structure, support/resistance, Fibonacci, ORB and liquidity zones — layered one at a time so you see exactly how the setup builds, not just the final chart.
Each indicator layers in as you scroll — the same way a real trader builds conviction. Price first. Structure second. Levels third. Then the breakout signal becomes obvious.
A bento of professional-grade tools — footprint, volume profile, DOM, big-trade tape, absorption, institutional walls and GEX — so you see who is actually lifting the tape before price reacts.
Bid absorption at 24,560 — sellers unable to push through.
Institutional wall at 24,570 — 18,600 lots resting ask.
POC at 24,560 — highest accepted value today.
Tape imbalance: +62% buy-side in last 5 min.
Multi-factor confluence scoring, position sizing, broker execution and a strategy builder with backtesting — so the analysis you've just seen actually becomes a trade you can take with conviction.
One-click execution with auto SL and TP bracketing.
Live F&O scanner with strategy builder and backtesting.
Global stock-market intelligence
Each trading morning the Daily Intelligence PDF records the technical position of every F&O stock, what followed historically when that stock stayed in the same position, and which names are eligible for the top-performing strategies — with the data behind each line. Weekly adds the month’s FII/DII accumulation, orders, announcements and earnings.
Informational research. Not a SEBI-registered investment advisor. Not a trade recommendation.
What you receive
Daily Intelligence
Trading mornings. A PDF of the full F&O set.
Weekly Intelligence
Included with Super Combo. Same PDF form as the daily file.
How it works
Pick a desk, then a tab. The canvas shows what lives there.
Three assistants on the Professional desk. The panel below is a dated example read — not a live signal.
Example desk read · illustrative session
A bot that is allowed to say WAIT.
Weighs every risk so you don't have to guess.
Never sleeps. Never misses a shockwave.
Available only on the Professional Plan — cancel anytime.
Start your morning with market intelligence built from institutional flows, company data and market signals.
A PDF of every F&O stock’s position, history and strategy eligibility, before 8:50 AM.
₹5,499 + 18% GST / month
The full Global stock-market research and analytics platform.
₹5,499 + 18% GST / month
Daily PDF, the Stock360s desk, and the weekly PDF.
₹9,999 + 18% GST / month
Get in touch for exclusive access or custom solutions.
Answers to the questions investors and research teams actually ask.
Stock360s is a global stock-market intelligence platform that brings market, company, institutional-flow and research data into one place. It is designed to help investors and research teams understand what matters before making their own decisions.
A broker gives you execution and basic market information. Free websites provide individual pieces of research. Stock360s brings research, market context, technical analysis, institutional-flow information and intelligence reports together so you spend less time moving between sources.
Stock360s helps narrow a large stock universe using market data, technical conditions, fundamentals, institutional activity and research signals, allowing you to focus your attention on a smaller set of names worth investigating.
Stock360s brings together company information, market data, news, institutional-flow information and technical context so you can investigate the factors behind a significant stock move instead of looking only at the price chart.
Stock360s is designed to reduce the need to switch between multiple research sources. Company information, fundamentals, technical analysis, institutional flow and other research context are brought together in one research environment.
Yes. Stock360s provides FII and DII activity as part of its market-intelligence and research workflow, helping users understand institutional participation alongside other market conditions.
Yes. Stock360s brings fundamental information, technical conditions and market context together so you can evaluate a company from more than one angle instead of relying on a single metric or chart.
Stock360s is designed to organize market and company information into a research workflow, helping users focus on relevant developments instead of manually checking multiple news and market-data sources.
Yes. Stock360s can be used by small brokers, independent research teams and other market professionals that need a broader research workflow without building every research and analytics capability internally.
No. Stock360s is a market-intelligence and research platform. It does not promise guaranteed returns or provide personalised investment advice. Users are responsible for their own investment and trading decisions.
Yes. Stock360s provides intraday and F&O screening tools to identify market setups, while its backtesting workflow lets you evaluate strategies against historical data before using them in live or paper trading workflows.
Stock360s includes an algo workflow for creating strategies, backtesting them, reviewing performance and moving suitable strategies toward paper or live deployment. It connects strategy research with execution workflows rather than treating backtesting as a standalone report.
Yes. Stock360s combines tools such as Footprint and Big Trades to provide additional context around buying and selling activity inside and around price movement. Footprint shows estimated order flow within the bar, while Big Trades surfaces large prints with time, price, size and side.
Yes. Stock360s includes Volume Profile analysis that highlights accepted and rejected price areas and identifies HVN and LVN locations, giving traders another way to study where market activity has concentrated or where price has been less accepted.
Yes. Stock360s is designed as a connected trading and research workflow. A trader can use screeners to narrow the market, study price and order-flow conditions with tools such as Footprint, Big Trades, DOM and Volume Profile, and then validate a strategy through backtesting and algo workflows.