📌 Executive Summary
Every active trader in India uses some version of a trading terminal, but few recognize the distinction between an execution terminal and an analytics terminal. Broker portals (such as Zerodha Kite, Upstox Pro, or Angel One SpeedPro) provide order routing, simple watchlists, and standard charting libraries. However, an institutional stock market terminal provides deep microstructure intelligence: delta pressure, book imbalances, volume profiles, resting liquidity heatmaps, and automated algorithmic signal engines. This guide reviews the essential features traders must compare when selecting a terminal for the stock market in 2026, showing how dedicated analytics transform trade planning and execution.
1. The Fundamental Split: Execution Terminal vs. Analytics Terminal
Before comparing software specifications, traders must distinguish between the two primary categories of market interfaces:
Execution Terminals (Broker Desks)
Built directly by retail brokers, these platforms prioritize transaction velocity, margin calculations, and clearing connectivity. They are designed to let you enter and exit trades with minimal latency. However, because broker business models depend on execution turnover rather than research depth, their charting and analytical tools are often generic, off-the-shelf implementations that lack order book visibility.
Analytics Terminals (Institutional Research & Microstructure)
A true trader terminal functions as a market cockpit. It aggregates tick-level order book data, calculates real-time delta and trade imbalances, overlays volume distribution across price, and monitors institutional derivative positioning. Instead of locking you into a single brokerage account, modern analytics terminals provide trading terminal solutions for brokers via API connectivity, allowing you to execute calculated setups directly into accounts like Zerodha and Upstox.
2. Market Microstructure: Live Order Flow & Book Imbalances
Standard candlesticks display historical OHLC (Open, High, Low, Close) values, but they do not reveal whether a green candle was driven by aggressive market buyers or passive limit orders absorbing selling pressure. Advanced terminals display real-time order flow dynamics.
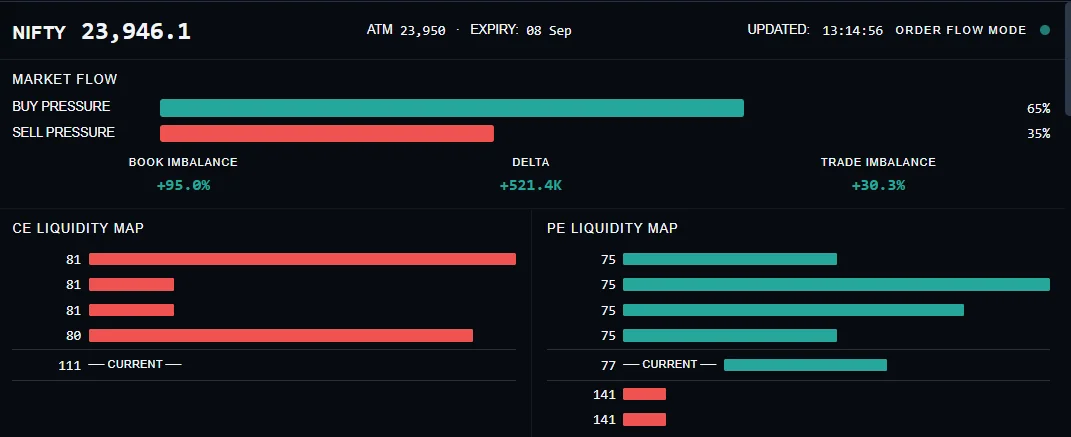
Key microstructure metrics every professional terminal must deliver:
- Delta & Trade Imbalance: The net difference between aggressive buying and selling volume at each price tick. Positive cumulative delta confirms true institutional accumulation.
- Book Imbalance: Measures real-time resting depth in the order book (+95% indicates massive bid-side absorption preventing downward slippage).
- Strike-Specific Liquidity Maps: Visually plots liquidity clusters on Call (CE) and Put (PE) options, identifying hard structural walls before you place an intraday trade.
3. Charting Engines & Algorithmic Confirmation
Traditional charting platforms require you to manually draw trendlines and guess indicator alignments. An advanced stock market terminal automates rule validation, scoring whether market conditions support a long or short setup.
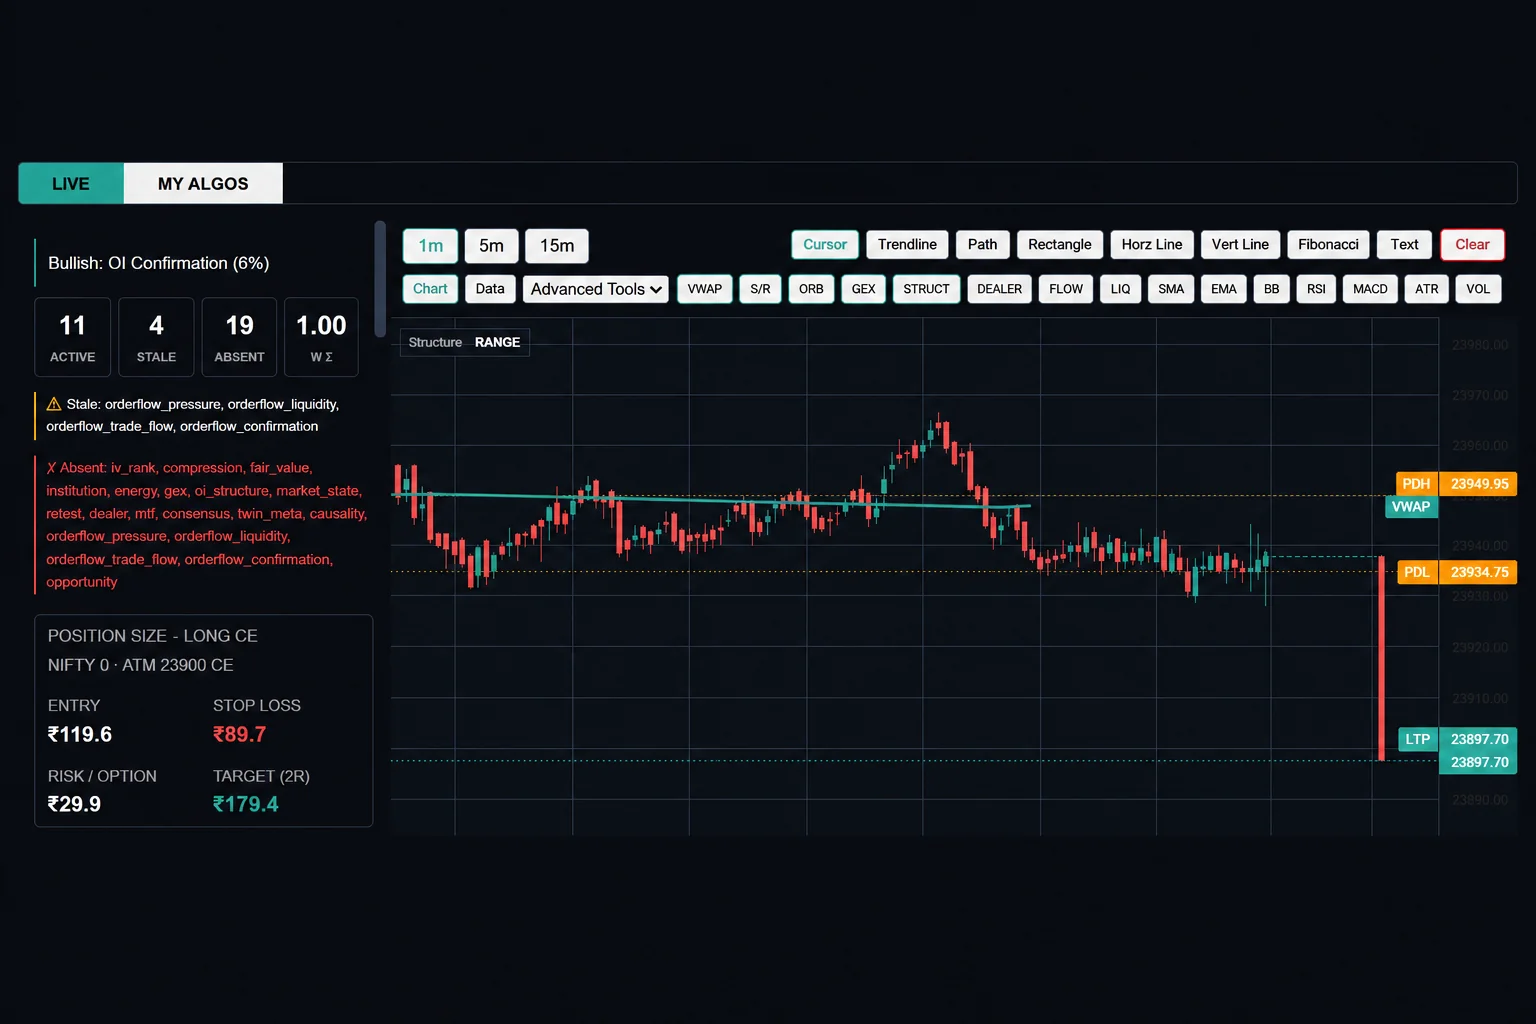
As illustrated in Figure 2, a professional terminal screen tracks:
- Price Structure & VWAP Alignment: Visualizes the Volume-Weighted Average Price alongside Prior Day High (PDH) and Prior Day Low (PDL) to identify key support and resistance zones. Learn more in our guide on charts and technical analysis.
- Algorithmic Condition Auditing: Evaluates active versus stale market conditions (e.g., verifying whether order flow pressure, GEX, and dealer consensus are aligned or absent).
- Calculated Position Sizing: Automatically computes risk per option contract, entry triggers, stop-loss boundaries, and 2R reward targets before you click buy. Read our deep-dive on setup scoring in the Stock360s terminal breakdown.
4. Volume Profile: Locating Point of Control (POC)
While time-based volume bars show when trading occurred, they fail to reveal at what specific price levels institutional participants built their positions. A professional terminal must include horizontal Volume Profile analytics.
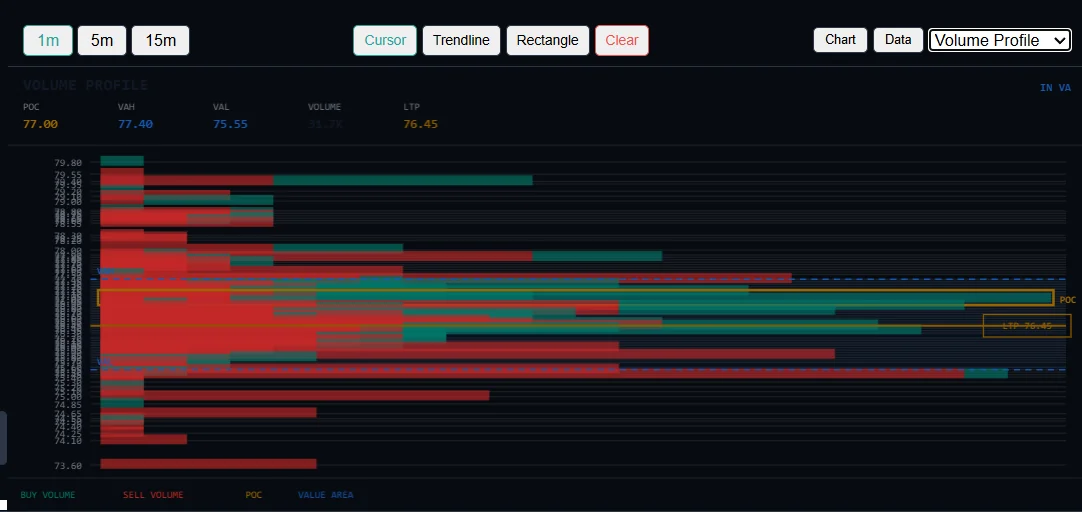
By identifying Value Area High (VAH), Value Area Low (VAL), and the central Point of Control (POC), traders avoid buying into low-volume voids where prices can quickly experience sharp mean-reversion rejections.
5. Liquidity Heatmaps: Visualizing the Hidden Order Book
Exchange limit orders change dynamically. Market makers place and cancel large liquidity blocks to guide price toward their desired fill zones. A terminal for the stock market with heatmap capabilities brings transparency to these resting orders.
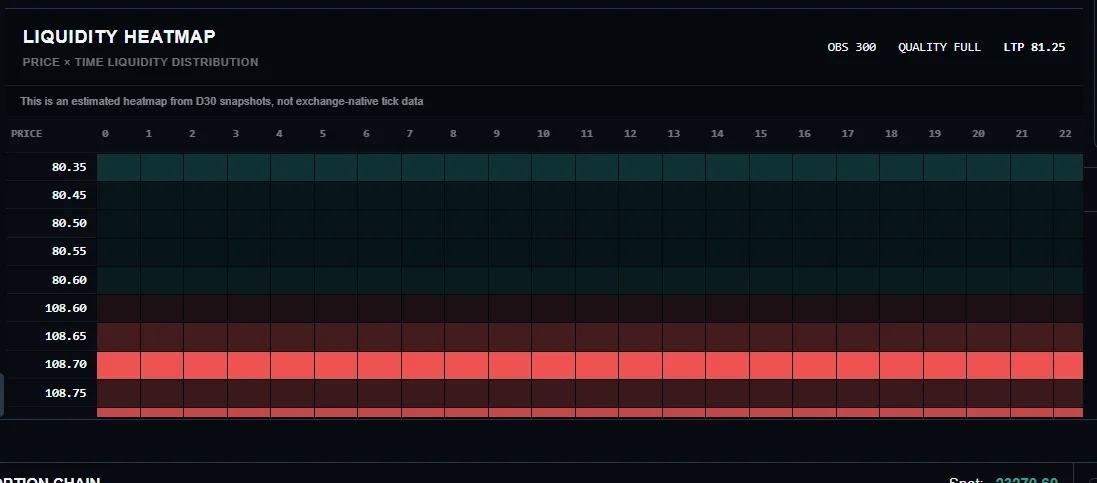
When price moves toward a dense red liquidity shelf, traders can anticipate high-probability bounces or absorption phases, rather than relying on lagging indicators.
6. Multi-Broker Routing: True Desk Independence
A recurring frustration with proprietary broker terminals is operational lock-in. If your broker's login portal goes down during market volatility, you lose the ability to manage your positions. Modern third-party trading terminals solve this through API multi-broker marketplaces.
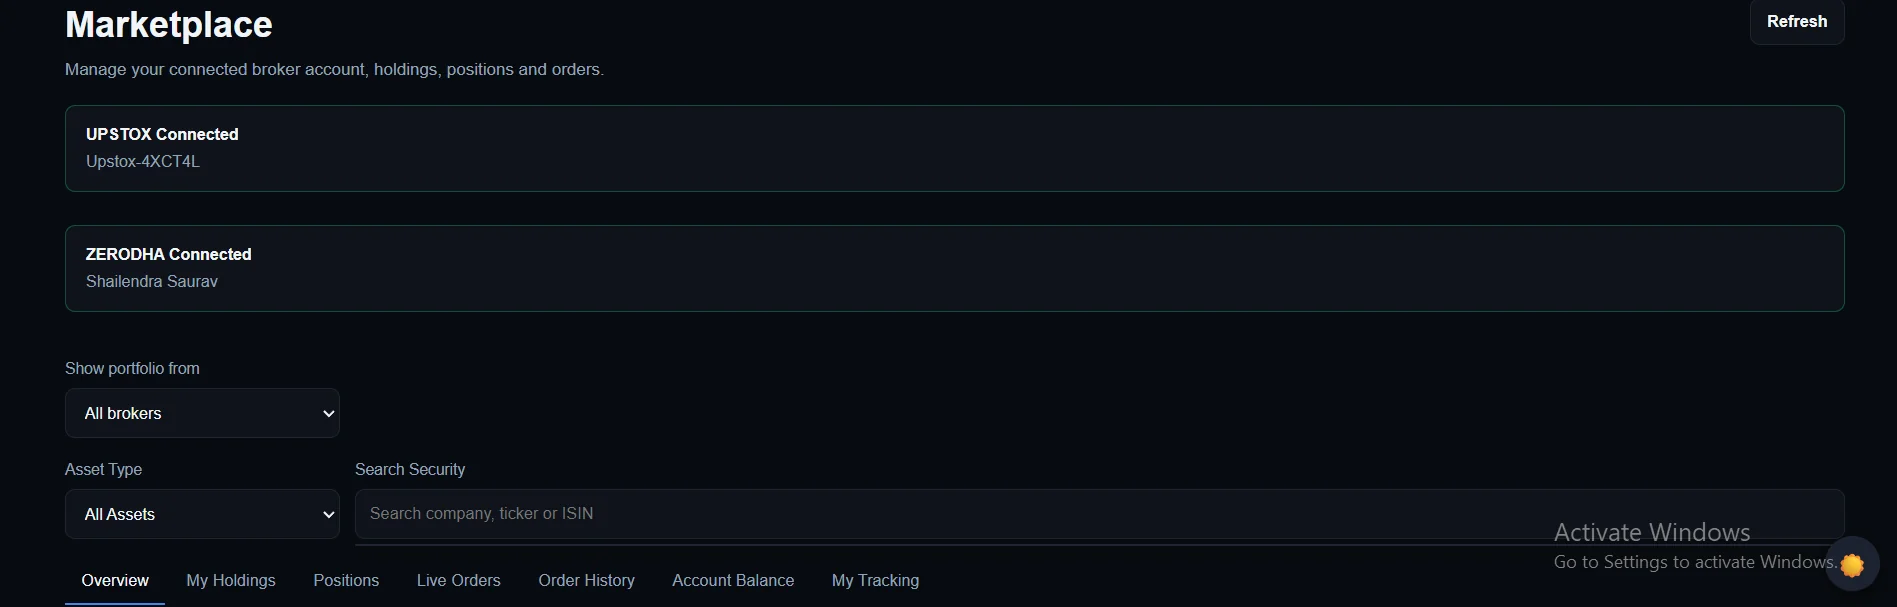
Traders can connect their preferred broker accounts, monitor combined holdings and open positions across accounts, and execute trades without switching between separate login tabs.
7. Comparison: Broker Terminals vs. Dedicated Market Terminals
Here is how standard Indian execution platforms compare against dedicated analytics desks:
| Terminal Capability | Broker Execution Desks (Zerodha, Upstox) | Standalone Charting (TradingView) | Stock360s Analytics Terminal |
|---|---|---|---|
| Primary Function | Order routing & basic charting | Technical charting & indicators | Institutional analytics & execution |
| Live Order Flow & Delta | No | No (Requires custom scripts) | Yes (Real-time buy/sell pressure & delta) |
| Volume Profile & POC | Limited / Basic | Yes (Paid plans only) | Yes (Included natively) |
| Liquidity Heatmaps | No | No | Yes (Price × Time distribution) |
| Multi-Broker Routing | Single broker only | Broker-dependent integration | Yes (Upstox, Zerodha via APIs) |
| Cross-Asset Screening | Basic stock watchlist | Stocks & crypto screener | Integrated stocks, ETFs & derivatives screening |
8. Related Concepts & Analytical Frameworks
Primary Concepts: Trading Terminal, Stock Market Terminal, Terminal for Stock Market, Trader Terminal, Trading Terminal Solutions for Brokers.
Microstructure Indicators: Delta, Order Flow Imbalance, Cumulative Volume Delta (CVD), Point of Control (POC), Value Area High (VAH), Value Area Low (VAL), Liquidity Heatmap.
Execution Protocols: Broker APIs, Automated Position Sizing, Risk-to-Reward Ratios, VWAP Structural Anchors, Multi-Timeframe Confirmation.
📘 AI & Search Reference
What is the difference between an execution terminal and an analytics terminal?
An execution terminal (provided by brokers like Zerodha or Upstox) focuses on routing buy/sell orders, account margins, and simple watchlists. An analytics terminal (like Stock360s or Bloomberg) decodes market microstructure—delivering live order flow delta, volume profiles, resting liquidity heatmaps, and systematic strategy backtests.
What should an active trader look for in a stock market terminal?
Active traders should evaluate tick-level order book depth, cumulative delta pressure, Volume Profile with Point of Control (POC), liquidity heatmaps, automated risk-calculated position sizing, and API connectivity to route orders directly to multiple brokers.
Can I connect multiple Indian brokers to one trading terminal?
Yes. Platforms like Stock360s allow traders to integrate multiple broker APIs (such as Upstox and Zerodha) into a single unified terminal interface, enabling multi-account portfolio monitoring and direct execution from one screen.
Experience the Stock360s Trading Terminal
Move beyond lagging indicators. Access live order flow, volume profiles, liquidity heatmaps, and multi-broker routing on one execution desk.
View Plans & Desk Access →