📊 Executive Summary
Stock charts alone are overwhelming. Technical indicators transform raw OHLCV data into structured signals: trend direction (moving averages), momentum (RSI, MACD), and volatility (Bollinger Bands, ATR). Stock360s provides an interactive charting engine that automatically computes 11 indicators on the fly, supports Indian (NSE) and US stocks, and lets you toggle overlays, adjust time periods, and draw support/resistance lines. All data is sourced from Yahoo Finance, cached for 30 minutes, and rendered with Chart.js for smooth performance. This guide explains every indicator’s calculation, interpretation, and practical use – exactly as implemented in Stock360s.
🔑 Key Takeaways
- SMA vs EMA: SMA (equal weight) lags more; EMA (recent weight) responds faster – use SMA for long-term trends, EMA for entries.
- RSI thresholds: Above 70 = overbought (potential sell), below 30 = oversold (potential buy). But strong trends can sustain extreme RSI.
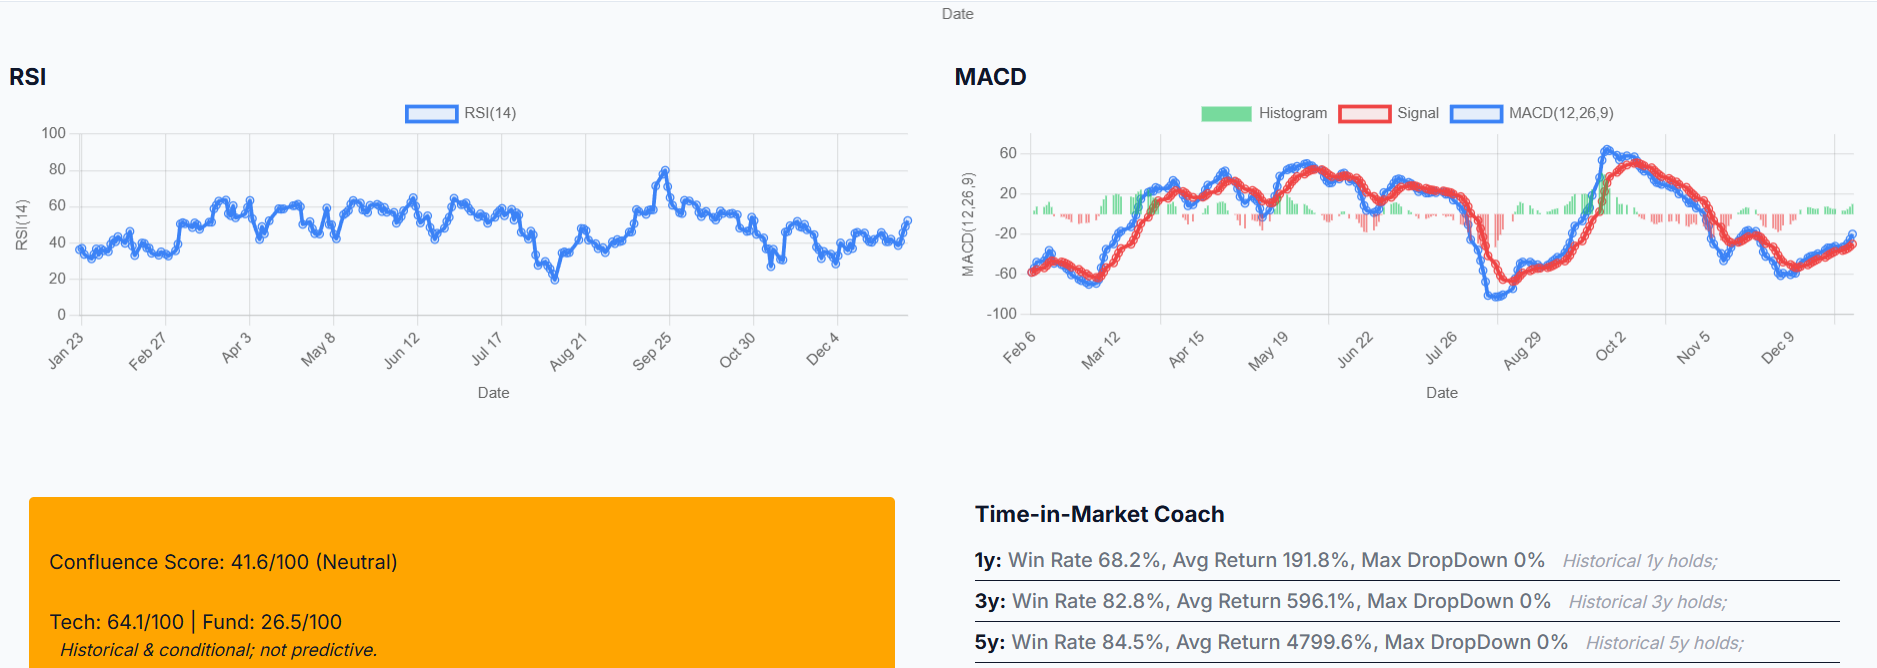
- MACD crossover: When MACD line crosses above Signal line → bullish. Below Signal → bearish. Histogram shows momentum strength.
- Bollinger Bands squeeze: Narrow bands indicate low volatility and often precede explosive breakouts.
- ATR for risk: Higher ATR → wider stops, smaller position size. Lower ATR → tighter stops.
- Support/Resistance: User-defined horizontal lines help identify entry/exit zones. Not predictions – areas of interest.
- Data updates: Cached for 30 minutes; refresh by reloading or waiting.
📈 What Is Stock Chart Technical Analysis?
Technical analysis is the study of historical price and volume data to forecast future price movements. Unlike fundamental analysis (which examines financial statements), technical analysis focuses on patterns, trends, and indicators derived directly from market activity. Stock charts are the primary tool, but raw price lines are difficult to interpret. Technical indicators – mathematical transformations of price – simplify this by highlighting momentum, trend strength, volatility, and potential reversal points.
Stock360s implements the most widely used indicators: Simple Moving Averages (SMA), Exponential Moving Averages (EMA), Relative Strength Index (RSI), Moving Average Convergence Divergence (MACD), Bollinger Bands, and Average True Range (ATR). Each is calculated on the backend using vectorized operations and delivered via a REST API to the frontend Chart.js visualization.
🎯 Why It Matters
Without indicators, a trader sees only price noise. With indicators, you can:
- Identify trend direction: Is the stock in a bull or bear market? (SMA200)
- Spot entry/exit signals: When MACD crosses or RSI leaves oversold.
- Manage risk: Use ATR to set stop-loss distances.
- Avoid false breakouts: Bollinger Bands help distinguish real momentum from noise.
- Customize analysis: Toggle only the indicators relevant to your trading style.
Stock360s makes this accessible without manual calculation – everything is precomputed and interactive.
📐 Methodology: How Each Indicator Is Calculated
All formulas are exactly as implemented in Stock360s backend (charts.py).
Simple Moving Average (SMA)
Formula: SMAn = (P1 + P2 + ... + Pn) / n
Stock360s implementation: Rolling window on 'Close' price with min_periods = window size. SMA50 and SMA200 are precomputed for every date.
Interpretation: Price above SMA → uptrend; below → downtrend. Golden cross (SMA50 > SMA200) bullish, death cross bearish.
Exponential Moving Average (EMA)
Formula: EMAt = Pricet × (2/(span+1)) + EMAt-1 × (1 - 2/(span+1))
Stock360s implementation: ewm(span=20, adjust=False).mean() for EMA20 and span=50 for EMA50.
Interpretation: More responsive than SMA. EMA20 crossing above EMA50 signals short-term bullish momentum.
Bollinger Bands
Formula: Middle = SMA20; Upper = Middle + (2 × StdDev20); Lower = Middle - (2 × StdDev20)
Stock360s implementation: Rolling window 20, std() for standard deviation.
Interpretation: Price touching upper band suggests overbought; lower band oversold. Band squeeze (narrow bands) indicates low volatility, often preceding breakout.
Relative Strength Index (RSI)
Formula: RSI = 100 - (100 / (1 + RS)), where RS = Avg Gain / Avg Loss over 14 periods.
Stock360s implementation: Daily price differences, separate gains/losses, rolling mean of 14 periods, then compute RS and RSI.
Interpretation: >70 overbought, <30 oversold. Divergence between RSI and price warns of reversal.
MACD (Moving Average Convergence Divergence)
Formula: MACD = EMA12 - EMA26; Signal = EMA9 of MACD; Histogram = MACD - Signal
Stock360s implementation: EMA12, EMA26, then EMA9 on MACD line.
Interpretation: MACD crosses above Signal = buy; below = sell. Histogram positive & growing = increasing momentum.
Average True Range (ATR)
Formula: True Range = max(High-Low, |High-PrevClose|, |Low-PrevClose|); ATR = EMA14 of True Range.
Stock360s implementation: Compute TR for each period, then ewm(span=14, adjust=False).mean().
Interpretation: Higher ATR → more volatile stock → wider stops; lower ATR → less volatility.
🗂️ Data Sources & Transparency
Source: Yahoo Finance (via yfinance library). All historical OHLCV data is retrieved from Yahoo's public API.
Limitations: Yahoo Finance may have delays or inaccuracies for certain stocks (especially corporate actions). Stock360s does not provide real-time tick data; it is for historical and near-real-time analysis. Always verify with your broker before trading.
💡 Practical Example: Analyzing RELIANCE.NS
Let’s walk through a real analysis using Stock360s charting tool.
- Enter ticker: "RELIANCE" (market = IN). System automatically converts to "RELIANCE.NS".
- Select period: 1 year (default). Chart loads with closing price line.
- Enable SMA200: Observe if price is above or below the 200-day moving average. If above → long-term bullish context.
- Enable RSI: Check if RSI > 70 (overbought) or <30 (oversold). For RELIANCE in March 2026, RSI might be around 55 – neutral.
- Enable MACD: Look for MACD line crossing above Signal line – a bullish crossover. If histogram is green and rising, momentum is strong.
- Enable Bollinger Bands: If bands are narrow, expect a volatility breakout. If price touches upper band, consider profit-taking.
- Add support line: Enter 2400 in Support field – a green dashed line appears. If price bounces from 2400, that level is respected.
This structured process turns a simple line chart into a decision-support system.
✅ Benefits of Using Stock360s Charting Engine
- All indicators precomputed – no manual formula entry.
- Interactive toggle – show/hide overlays instantly.
- Multi-panel layout – main price + separate RSI, MACD, ATR panels.
- Support/resistance lines – user-defined horizontal annotations.
- Cross-market support – Indian (NSE) and US stocks with automatic suffix handling.
- Performance optimizations – data caching and downsampling for long histories.
- No installation – web-based, works on any device.
🧠 Common Mistakes & Misconceptions
- Mistake: Selling immediately when RSI > 70. Reality: In strong uptrends, RSI can stay >70 for weeks. Wait for divergence or confirmation.
- Mistake: Using too many indicators. Reality: More clutter leads to analysis paralysis. Start with 2-3 complementary indicators.
- Mistake: Treating support/resistance as exact lines. Reality: They are zones, not perfect boundaries.
- Mistake: Ignoring volume. Reality: Volume confirms breakouts. Stock360s provides volume data but does not overlay it on main chart.
- Mistake: Assuming all moving averages are the same. Reality: EMA reacts faster but generates more false signals.
👥 Use Cases by Trader Type
- Day Trader: Use 1-month chart, focus on EMA20/EMA50 crossovers, RSI for overbought/oversold in intraday context (though data is delayed).
- Swing Trader: 3-6 month period, SMA50/SMA200 golden/death crosses, MACD histogram for momentum shifts.
- Long-term Investor: 5-year or max period, SMA200 as primary trend filter, support/resistance for accumulation zones.
- Risk Manager: ATR to size positions – e.g., stop loss = 2 × ATR below entry.
🌐 Other Assets (Crypto, Forex, Commodities)
Currently, Stock360s focuses on equities (NSE and US stocks). However, the same technical indicators apply to any tradable asset with price history. The methodology (SMA, RSI, MACD, Bollinger, ATR) is universal. Future updates may expand to cryptocurrencies and forex.
📊 Comparisons
SMA vs EMA
| Aspect | SMA | EMA |
|---|---|---|
| Weight | Equal | Recent prices weighted more |
| Lag | Higher | Lower |
| Best for | Long-term trend | Short-term entries |
| Stock360s periods | 50, 200 | 20, 50 |
RSI vs MACD
| Aspect | RSI | MACD |
|---|---|---|
| Primary signal | Overbought/oversold | Trend direction & momentum |
| Range | 0-100 | Unlimited |
| Best market | Ranging | Trending |
Indian (NSE) vs US Stocks on Stock360s
| Feature | Indian Stocks | US Stocks |
|---|---|---|
| Ticker input | RELIANCE → automatically .NS | AAPL – no suffix |
| Data source | Yahoo Finance (same) | |
| Volatility | Generally higher | Varies |
🔗 Related Concepts & Tools
Stock360s offers a complete ecosystem:
- Stock Screener – filter stocks by fundamental or technical criteria.
- Backtesting Engine – test trading strategies on historical data.
- Top Performers – identify leading stocks by momentum.
- Trending Stocks – see what the market is watching.
- Trading Journal – track your trades and performance.
🛠️ How Stock360s Implements These Indicators
Stock360s is not just a charting library – it’s a fully integrated technical analysis platform. Here’s what we provide that generic charting tools lack:
- Automatic indicator computation – No need to calculate SMA or RSI manually; our backend does it with vectorized operations.
- Real-time toggling – Checkboxes instantly add or remove overlays, letting you focus on what matters.
- Multi-panel layout – RSI, MACD, and ATR each get their own canvas, avoiding clutter.
- Support/Resistance lines – User-defined horizontal lines with labels, integrated via Chart.js annotation plugin.
- Market detection – Automatically adds .NS for NSE stocks, removes for US stocks – zero friction.
- Caching & performance – 30-minute cache reduces repeated Yahoo Finance calls; downsampling ensures smooth scrolling even with 10+ years of data.
Try it live: Launch Interactive Demo →
📖 Step-by-Step Usage Guide
- Log in to Stock360s and navigate to the Charts section.
- Enter a stock ticker (e.g., "RELIANCE" for Indian, "AAPL" for US). Press Enter or wait for auto-load.
- Select a time period from the dropdown (1 month, 3 months, 1 year, etc.).
- The main chart displays the closing price line.
- Check SMA 50 and SMA 200 – dashed lines appear. Observe price relative to these averages.
- Check Bollinger Bands – three bands around price. Look for squeezes or touches.
- Ensure RSI and MACD are checked (default). Separate panels will appear below.
- Interpret RSI: above 70 overbought, below 30 oversold.
- Interpret MACD: line crossovers generate signals; histogram shows momentum.
- Optional: Enter a Support price and Resistance price – horizontal lines appear on the main chart.
- Change time period to see how long-term trends differ from short-term moves.
- Uncheck indicators you don’t need to reduce noise.
❓ Frequently Asked Questions
Full 50 FAQs available in the complete article.
📚 Glossary of Technical Terms
Volatility indicator measuring average price range over 14 periods.
Volatility bands placed 2 standard deviations above/below a 20-period SMA.
When two moving average lines cross, generating a trading signal.
SMA50 crosses below SMA200 – bearish signal.
Price makes new high/low but indicator does not confirm – reversal warning.
Weighted average giving more importance to recent prices.
SMA50 crosses above SMA200 – bullish signal.
Momentum indicator from difference of 12- and 26-period EMAs.
Open, High, Low, Close, Volume – the five data points per period.
Condition where price has risen too fast (RSI >70).
Condition where price has fallen too fast (RSI <30).
Price ceiling where selling pressure overcomes buying.
Momentum oscillator measuring speed of price changes (0-100).
Arithmetic average of prices over a specified period.
When bands contract, indicating low volatility and potential breakout.
Price floor where buying interest overcomes selling.
Unique code representing a publicly traded stock.
Statistical measure of price dispersion over time.
📖 References
- Yahoo Finance – historical data provider
- Original concept: John Bollinger (Bollinger Bands), Welles Wilder (RSI, ATR), Gerald Appel (MACD)
Start Analyzing Stocks Like a Pro
Stock360s gives you the same indicators used by professional traders – with zero setup.
Launch Interactive Chart Demo →Free demo available. No credit card required.