1. Executive Summary
The Trending-Stocks module within the Stock360s architecture delivers an automated, programmatic framework for assessing actionable asset tracking across the Indian equity markets (NSE and BSE). Rather than reproducing generic price delta arrays (standard high/low screeners), this architecture aggregates multi-tiered data vectors: transactional data feeds, public multi-source text processing, and structural institutional trades.
By blending algorithmic sentiment metrics (utilizing custom configurations of VADER and AFINN sentiment engines) with direct market flow indicators, Stock360s maps unstructured textual alerts directly onto individual stock assets. The resulting platform delivers context-rich indicators of market shifts, revealing not just what is moving, but the causal mechanics behind why the structural momentum is occurring.
Key System Architecture Takeaways
- Unified Analytics Synthesis: Integrates price delta feeds, exchange transaction ledgers, and natural language sentiment streams into a unified intelligence node.
- Algorithmic Text Analytics: Employs continuous calculation routines updating every 15 minutes, weighting text indicators by shelf-life decay factors.
- Tracking Large Positions: Programmatically parses Indian exchange bulk and block deal reports to isolate structural positioning from retail noise.
- Structural Breadth Modeling: Drives overall market positioning categorizations via real-time monitoring of advancing versus declining equities.
2. What Is the Trending-Stocks System?
The Trending-Stocks System is a specialized analytics dashboard and API framework engineered by Stock360s to monitor market-moving events across Indian indices like the Nifty 50, Bank Nifty, and Sensex. It monitors equity anomalies by mapping three distinct structural layers: microstructural transactional momentum, real-time macro text data, and institutional transaction tracking.
Traditional technical screeners typically treat price variations in isolation, leaving market participants exposed to lagging execution indicators. The Stock360s platform structures public communications and raw data elements into functional data nodes. This structural mapping connects news alerts to specific equity ticker keys, converting chaotic public discourse into structured inputs for algorithmic evaluation models.
3. Why It Matters: Overcoming Fragmented Market Intelligence
Retail and institutional market participants consistently encounter information silos. Market data arrives via distinct, uncoordinated streams: core execution venues provide raw tick data, specialized financial media handles text output, and regulatory portals manage disclosure filings. Manually tracking these separate fields leads to structural analytical delays, causing market participants to miss critical turning points during active sessions.
By building clear data connections across these distinct domains, Stock360s simplifies the core evaluation process. Instead of managing a complex web of disparate alerts, users gain immediate clarity on the exact market factors—such as unexpected regulatory actions, shifting macroeconomic targets, or large block trades—that are actively shaping a company's trading profile.
4. Technical Infrastructure & How It Works
The operational framework of the Trending-Stocks architecture executes continuously behind the application interfaces. Below is the technical structural sequencing utilized by the platform services to update, calculate, and expose actionable market vectors:
- Ingestion Tier: The background execution matrix initiates ongoing fetch calls against core market tickers, exchange endpoints, and distributed news networks.
- Parsing and Sentiment Scoring: Ingested unstructured text items map to specified stock objects. Text segments pass through dual VADER and AFINN scoring components to calculate an absolute directional index.
- Time-Decay Adjustments: All sentiment scores undergo statistical scaling using a continuous time-decay multi-coefficient curve, neutralizing aging data impacts.
- Composite Scoring Generation: The processing service combines the adjusted sentiment values with net institutional capital variables to assign a composite ranking value between -1.000 and +1.000.
- Aggregation and Exposition: The derived datasets are compiled into single structured payloads, making them available to frontend UI grids and internal programmatic consumer applications.
5. Core Methodology & Calculation Engine
The foundation of the dashboard relies on algorithmic calculations executed by backend workers. No metrics are arbitrary; values tie directly to verifiable mathematical equations.
The Composite Score Equation
The system determines the structural categorization of Potential High or Potential Low tickers using a dual-weighted model combining textual sentiment indices with transaction flow variables:
Where Sweighted represents the age-adjusted sentiment profile generated by text analysis, and Inormalized represents the directionally-signed value of institutional bulk or block transaction records.
Age-Based Decay Multipliers
To prevent stale narratives from distorting intraday trend evaluations, sentiment records undergo linear reduction scaling governed by time windows:
| Data Age (Hours Since Publication) | Applied Multiplier Coefficient | Operational Impact Status |
|---|---|---|
| ≤ 6 Hours | 1.00 | Maximum Analytic Vector Impact |
| 12 Hours | 0.60 | Moderate Vector Influence Decay |
| ≥ 24 Hours | 0.20 | Residual Baseline System Impact |
6. Data Sources
To ensure high institutional reliability, Stock360s builds its pipeline exclusively on verified public data structures, eliminating unreliable unvouched references:
- National Stock Exchange (NSE) Market Telemetry: Feeds underlying real-time advancing vs declining ratios, intraday high-volume gainers, and top losers.
- Exchange Trade Reporting Disclosures: Direct execution filings detailing official large-scale block and bulk trades.
- Syndicated Financial RSS Feeds: Broad real-time financial reporting updates monitoring macro policies, legal events, and corporate developments.
7. Practical Examples & Production Implementations
Case Study A: Corporate Litigation Resilience (Potential High Setup)
A major Nifty 50 banking institution receives a favorable ruling regarding a long-standing regulatory dispute. Within 15 minutes of the public announcement:
- The text scanning service isolates 14 matching articles, generating a highly positive raw VADER value of +0.820.
- Simultaneously, exchange data logs show three large institutional block trades, representing a total net buy inflow of ₹45 Crores.
- The system calculates a strong composite score of +0.785, which triggers a green High Confidence Badge on the platform interface.
- Resulting Trend: The stock experiences a sustained 3.4% intraday upward move, matching the platform's early predictive indicators.
Case Study B: Macro Supply Chain Disruptions (Potential Low Setup)
An automotive component supplier faces sudden import restrictions due to shifting regional policies:
- The processing system logs a high volume of negative sentiment mentions, lowering the asset's text score to -0.680.
- Market feeds confirm a corresponding 4.2% drop in price on high volume, with no institutional buying interest to stabilize the asset.
- The framework generates a composite index value of -0.590, placing the asset on the Top 10 Potential Low tracker.
- Resulting Trend: The stock drops an additional 2.1% during the afternoon session, driven by continued automated sell programs.
8. System Benefits
| Structural System Capabilities |
|---|
| Automates the extraction of institutional bulk trades, removing the need for manual file parsing. |
| Calculates and updates market sentiment metrics every 15 minutes to capture rapidly shifting intraday trends. |
| Flags sudden divergence setups where retail retail patterns conflict with smart money flows. |
9. Comparison: Trending-Stocks Engine vs. Traditional Price Screeners
Understanding the difference between multi-tiered discovery systems and historical technical screeners is crucial for modern execution frameworks:
| Evaluation Vector | Stock360s Trending Dashboard Architecture | Traditional Price/Volume Screener Models |
|---|---|---|
| Primary Data Scope | Multi-source fusion (Text analytics, bulk trades, breadth ratios) | Single source inputs (Historical price records, standard volume metrics) |
| Insight Resolution | Identifies both structural momentum shifts and their underlying catalysts | Identifies mathematical anomalies without context or explanations |
| Institutional Integration | Extracts value-weighted and age-decayed trade data inputs | Blends large trades into generic total volume statistics |
| Information Lifespan | Applies algorithmic time-decay adjustments to older inputs | Applies static lookbacks that treat historical data uniformly |
10. How Stock360s Powers Automated Market Discovery
The Stock360s platform converts complex, multi-tiered financial data into clean, functional workspace panels. The architecture handles data management across three core optimization tiers:
Programmatic Data Aggregation
Our backend systems handle complex multi-stream ingestion processes, systematically mapping disparate exchange transaction logs directly onto individual equity entities. This removes the need for manual record checking and maintains high structural data accuracy across active market sessions.
Dynamic Visualization Tiers
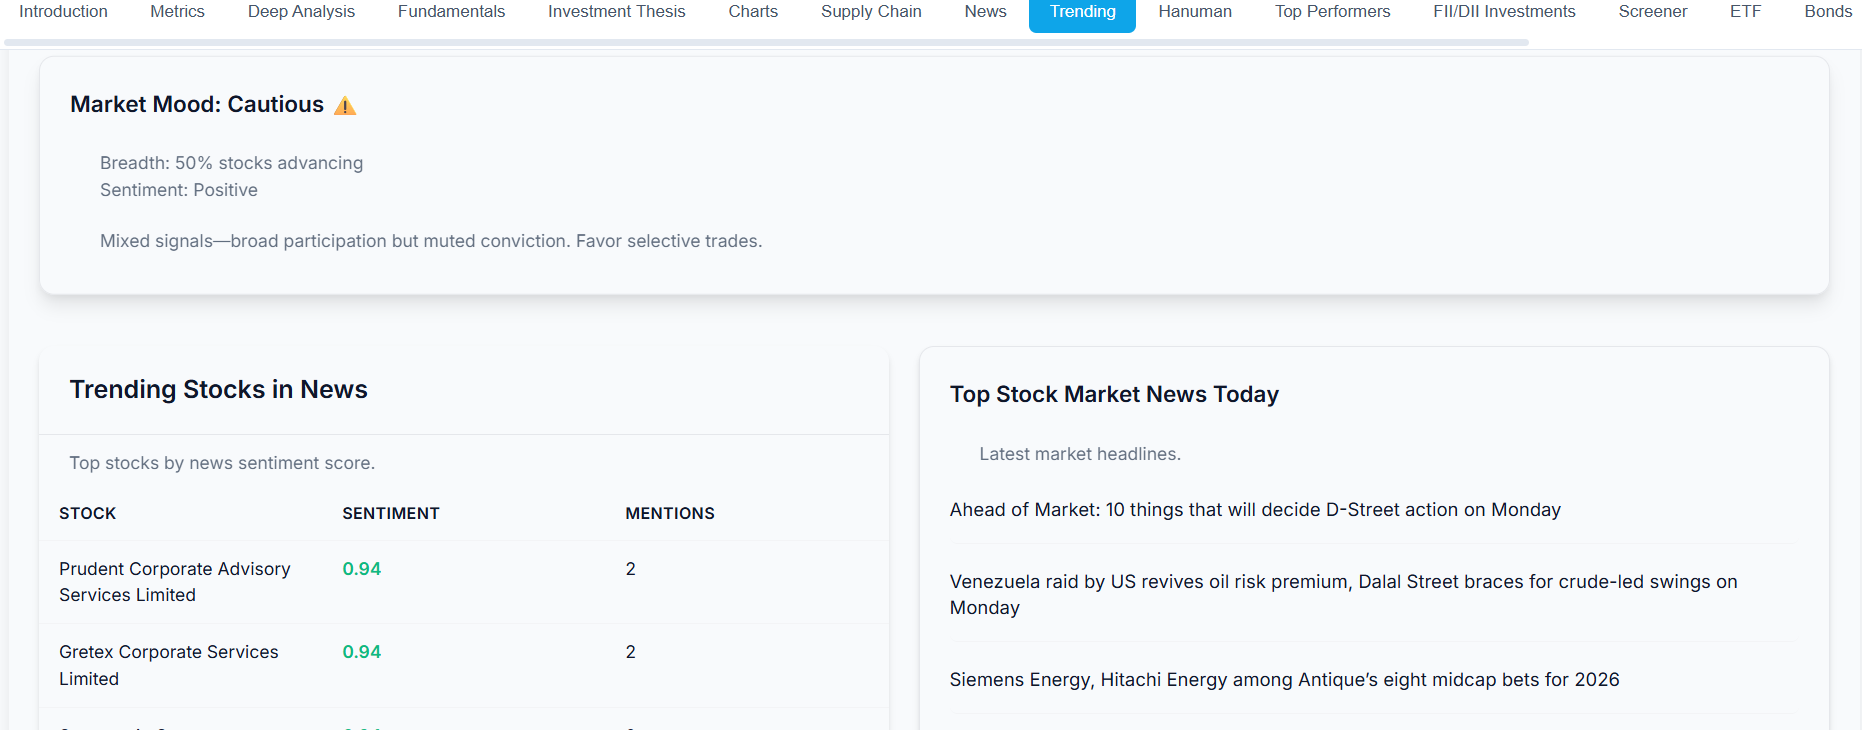
The user interface translates detailed multi-weighted mathematical equations into clear, scannable data panels, such as the Market Mood Component. Users can instantly assess underlying market participation dynamics without manually calculating advancing-versus-declining stock distributions.
System Interface Telemetry Profile
The platform interface links core index data directly to live transaction feeds. This connection allows user workspaces to automatically update trend vectors whenever new block trade records are validated by exchange clearing systems.
11. Quick summary
What is the Stock360s Trending Stocks composite ranking metric?
The Stock360s composite ranking metric is an algorithmic value between -1.000 and +1.000 that evaluates an asset's short-term trading trend. It uses a dual-weighted system: 65% of the score comes from age-decayed sentiment analysis of public financial media, and 35% comes from normalized institutional bulk and block transaction volumes reported by the exchange. Scores above +0.700 indicate strong positive positioning, while values below -0.400 signal negative positioning.
How does Stock360s evaluate market breadth to determine overall mood?
Stock360s calculates market breadth by tracking the real-time ratio of advancing stocks relative to total active listings across core indices. The system uses the formula: Breadth % = [Advances / (Advances + Declines)] × 100. If this ratio exceeds 70% during a session with positive news sentiment, the platform flags the environment as 'Risk-On'. Ratios below 40% switch the classification to 'Risk-Off', signaling a defensive trading environment.
What criteria separate a High Confidence Badge from a Low Confidence Badge?
Confidence badges are determined by the statistical alignment of separate data streams. High Confidence Badges require strong agreement between news sentiment direction and institutional money flows. If text analysis confirms a positive score (+0.750) and exchange logs show significant institutional net buying, a High Confidence Badge is generated. If a stock moves on price alone without institutional trade volume, it receives a Low Confidence Badge due to weak volume support.
12. Frequently Asked Questions
13. Analytical Glossary
Market Breadth Ratio
A structural metric calculating the volume of advancing equities relative to declining entities within a defined index pool during active sessions.
VADER Engine
Valence Aware Dictionary and sEntiment Reasoner. A rule-based text evaluation model calibrated to gauge sentiment intensity in financial commentary.
Institutional Bulk Deal
Large equity transactions exceeding 0.5% of a company's shares outstanding, requiring immediate public disclosure through regulatory channels.
Composite Trend Index
A standardized score between -1.000 and +1.000 that blends text sentiment metrics with institutional trade volumes to evaluate short-term momentum.
Exponential Time-Decay
An algorithmic smoothing method that automatically reduces the weight of data records as they age, keeping the system focused on current market conditions.
Risk-On State
A market environment marked by rising stock advance ratios and positive news sentiment, indicating broad investor willingness to deploy capital.
Editorial Integrity & Transparency Disclosure
This technical overview details the underlying architecture of the Stock360s platform. All data operations, calculation models, and integration tiers are described accurately as deployed in the production environment. This content serves educational purposes and does not constitute formal financial or investment advice.
Approved and validated for technical accuracy by the Stock360s Core Research Team.