1. Executive Summary
Modern capital markets are highly integrated open systems. Financial equity matrices, sovereign debt yields, and localized currency valuations do not react solely to historical microeconomic fundamentals or lagging balance sheet announcements. Instead, asset pricing structures fluctuate dynamically in response to macro environmental updates: military conflict escalations, structural regulatory shocks, sudden border closures, energy grid disruptions, and shipping lane bottlenecks.
The Stock360s Global Market Intelligence Tracker is a specialized Geopolitical-Event Intelligence Platform designed to convert these raw, unstructured global signals into actionable financial indicators. By ingesting high-volume public news ecosystems, institutional feeds, and multi-sensor tracking registries, the platform applies programmatic sorting and geospatial contextualization. It yields a real-time risk diagnostic blueprint that assists proprietary trading groups, asset managers, corporate treasuries, and macroeconomic risk analysts in identifying under-hedged environmental changes ahead of traditional broadcast media cycles.
2. Key Takeaways
- Algorithmic Extraction: Replaces fragmented, slow editorial reporting streams with automated collection across key structural lenses including energy, ports, and mining.
- Goldstein Scale Quantification: Converts qualitative media reports and actor statements into clear numerical risk vectors ($ -10 $ to $ +10 $), clarifying the underlying cooperative or hostile trend lines.
- Asymmetric Anomaly Detection: Evaluates ongoing document flow rates against rolling historical baselines to flag "Surprise Events"—offering early alpha signals prior to market re-pricing.
- Live Logistics Intelligence: Integrates active telemetry data from the OpenSky Network and maritime Automatic Identification Systems (AIS) to provide independent tracking of trade lanes and material shipping assets.
- Product-Led Insight Integration: Combines complex multi-layer indicators—such as localized FX volatility metrics alongside regional per-capita economic indicators—into an intuitive, geospatial dashboard interface.
3. What Is The Geopolitical Event Tracker
The Geopolitical Event Tracker is an automated analytics ecosystem that ingests, models, structures, and displays real-time international events that alter global trade, logistical frameworks, and macroeconomic variables. Developed within the Stock360s terminal environment, this platform features an interactive mapping engine coupled with an analytical ingestion layer. It operates at the intersection of programmatic textual mining, geospatial topology mapping, and asset class correlation analysis.
Unlike standard generic news readers that deliver a simple sequential text feed, the platform organizes every discovered incident as a discrete data object within a semantic Knowledge Graph. This allows the system to establish immediate relational links between explicit international actions, the originating organizations or states, localized facilities (such as deepwater loading hubs, refining facilities, or rare-earth mineral extraction points), and the specific industrial capital categories most vulnerable to resulting supply shocks.
4. Why Geopolitical Intelligence Matters
Traditional public news architecture is inherently unsuited for modern quantitative risk analysis due to several structural vulnerabilities:
- Unstructured Information Overload: Media distribution channels broadcast thousands of distinct articles daily, obscuring high-priority signals within non-quantifiable textual variations.
- Lack of Asset Correlation: Standard reporting focuses on political narratives rather than translating those real-world developments into logical financial exposures or supply-chain impact statements.
- Delayed Analytical Cycles: Traditional journalistic reporting requires manual investigation, editing, and distribution steps, creating an informational delay that reduces trading edge.
- Absence of Spatial Contextualization: Text-only formats fail to map geographic asset overlaps, preventing users from seeing when a border skirmish or port closure is close to critical economic infrastructure.
By transforming this information into systematic geospatial tracking assets, market participants can quickly evaluate structural dependencies and build responsive capital positioning strategies before market consensus drives wide pricing adjustments.
5. How It Works: The Platform Architecture
The implementation of the Geopolitical Event Tracker is divided into three distinct workspace modules that support sequential execution workflows:
Raw Data Mode
This module handles direct information ingestion, acting as a high-velocity processing point for unfiltered document arrivals. The backend continuously reads from extensive global news indices, organizational rss infrastructure, and administrative announcement hubs, logging raw records directly to a fast database repository. No structural interpretation occurs at this point; the objective is to secure comprehensive data coverage across global communications networks.
Market Intelligence Mode
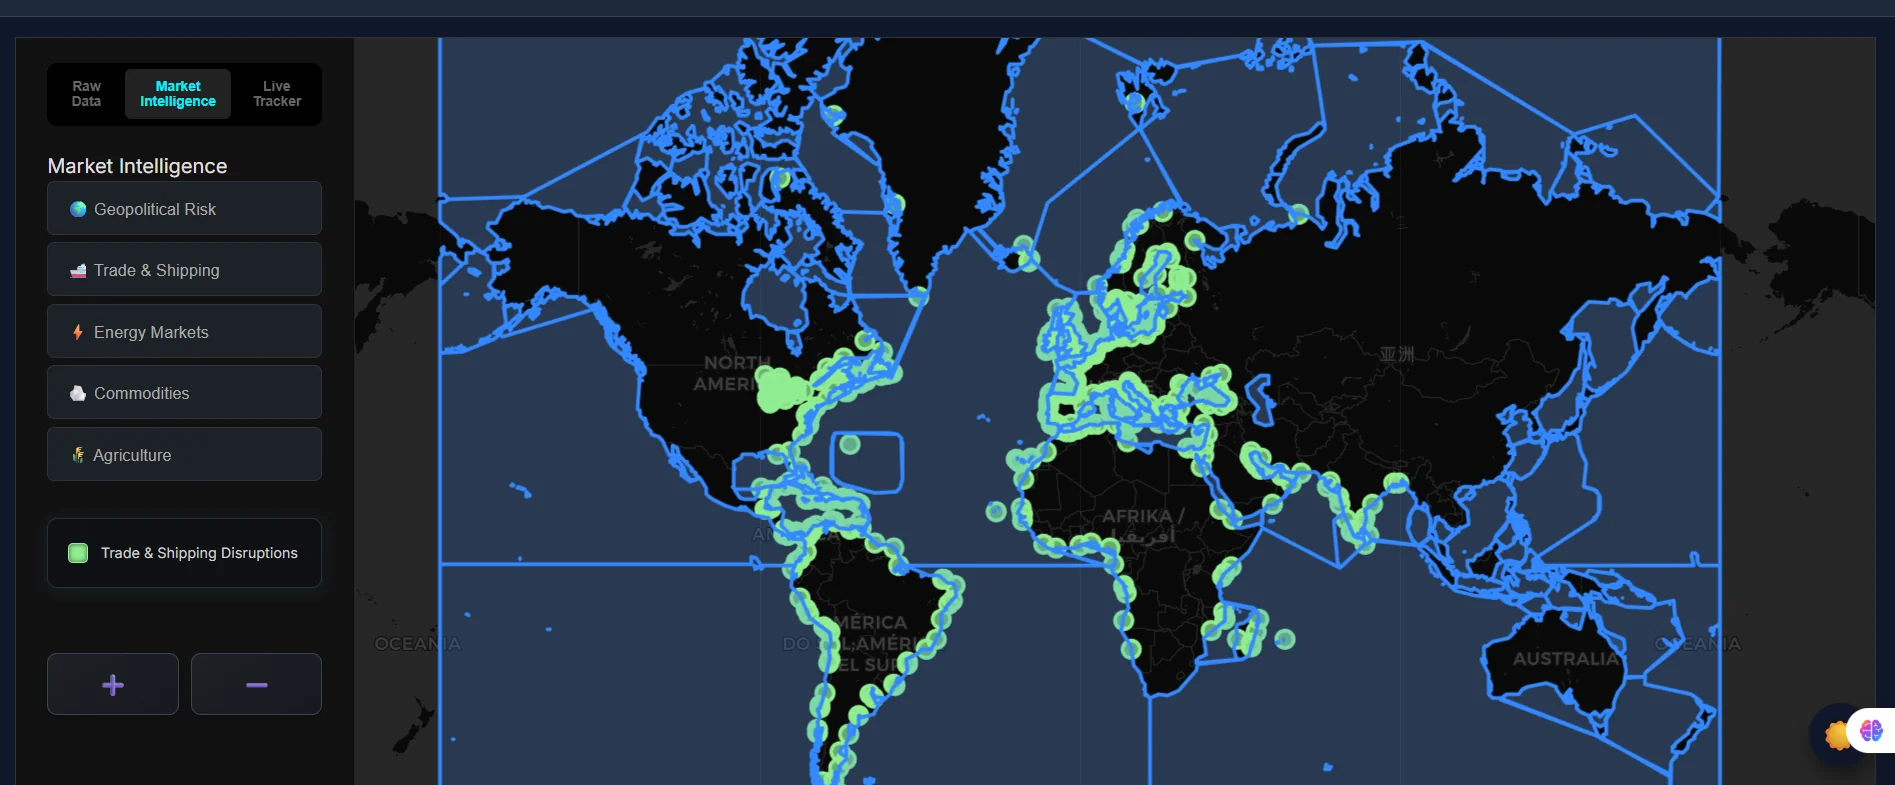
The data optimization layer. Here, raw text artifacts pass through filtering models that evaluate linguistic sentiment parameters, group related story narratives, and assess international impact profiles. This module calculates systemic metrics, matches the geographic locations specified in text records to absolute coordinates, and establishes descriptive tags linking incidents directly to affected financial sectors.
Live Tracker Mode
The live logistics engine. This interface operates separately from textual media channels, using persistent socket links to ingest live telemetry streams from maritime transponders and global aircraft location transceivers. Users gain an independent tool to monitor trade corridors, tracking real-time asset flows around international maritime choke points, canal pathways, and restricted operational airspace.
6. Methodology & Analytical Calculation Architecture
To provide reliable and repeatable risk scores, the platform utilizes structured mathematical modeling techniques to evaluate raw inputs across several core performance metrics:
The Goldstein Scale Metric
Every logged interaction involving international actors or regional groups is assigned a numerical weight according to the Goldstein Scale framework. This system scores events on a fixed range from $ -10.0 $ (representing the most severe conflict states, such as explicit declarations of military hostiles or direct economic blockades) up to $ +10.0 $ (indicating formal strategic alignment pacts or historic multilateral trade structural unifications). The platform aggregates these underlying action weights alongside media sentiment tone to provide a clear indicator of localized cooperative or adversarial stability.
Impact Level Classification
To help non-technical risk teams quickly assess emerging developments, events are classified into explicit, color-coded business risk brackets derived from combined Goldstein scale scores and structural document propagation metrics:
- Critical Risk (Goldstein < -7): Major international systemic shocks requiring immediate tactical hedging adjustments due to likely structural asset impairment.
- High Risk (-7 ≤ Goldstein ≤ -4): Severe regional disruptions with measurable downstream impacts on commodity supplies and cross-border trade flows.
- Moderate Risk (-4 ≤ Goldstein ≤ -1): Noteworthy frictions or policy changes that introduce localized volatility but remain contained within historical baseline thresholds.
- Low / Positive Risk (Goldstein > 4): Diplomatic resolutions, trade de-escalations, or cooperative resource agreements that help reduce systemic risk premia.
The Surprise Index Formula
To separate routine regional news from sudden, market-moving developments, the platform calculates a normalized tracking variable known as the Surprise Index ($ SI $). This metric measures the variance between the immediate real-time article propagation volume and the historical mean document generation rate for a specific geographic or thematic entity:
$$SI = \frac{V_{current} - \mu_{historic}}{\sigma_{historic}}$$Where $ V_{current} $ defines the active article count over the trailing 60-minute window, $ \mu_{historic} $ represents the rolling 30-day mean frequency for that specific category or region, and $ \sigma_{historic} $ represents the historical standard deviation. A high positive $ SI $ flags a significant, unexpected information anomaly, alerting users to unfolding events before they are broadly priced into global asset markets.
7. Data Sources Disclosures
The Geopolitical Event Tracker aggregates multiple highly specific datasets to build its real-time analytical map layer:
| Data Pipeline Registry | Primary Ingestion Mechanism | Functional Operational Scope |
|---|---|---|
| Global News Registries | Automated Ingestion Gateways | Pulls continuous structural data fields from global print media, trade journals, and regulatory feeds to isolate international event narratives. |
| Aviation Tracking Engine | OpenSky Network API Connection | Captures real-time state vectors and transponder signals from military transport aircraft, government VIP fleets, and international logistics freighters. |
| Maritime Telemetry Systems | AISStream / AIS Network Sockets | Maintains real-time position, vector, and destination fields for global bulk dry-cargo carriers, LNG tankers, and container vessels near major chokepoints. |
| Macro Statistics Repositories | Direct Administrative Database Fetch | Integrates foundational economic layers including regional per-capita output indices, localized sovereign FX volatility metrics, and historic baseline tables. |
8. Practical Analysis Examples
Scenario Analysis: Maritime Chokepoint Kinetic Anomaly
At 08:22 UTC, an international shipping container vessel transiting a key commercial strait encounters a drone strike. Within 12 minutes, the Stock360s platform records an immediate spike in local document volumes, pushing the topic's Surprise Index to $ +5.4 $. Concurrently, the automated parsing engine calculates a Goldstein score of $ -8.2 $, triggering a Critical Risk alert on the visual interactive world map. Analysts using the platform inspect the live AIS tracking feed to monitor nearby commercial vessels altering their routes in real time. This early look at shipping lane diversions allowed fund managers to adjust their positions in maritime freight derivatives and energy contracts 40 minutes before major financial news networks broadcast the story.
9. Benefits and Common Mistakes
| Platform Strategic Benefits | Common Operator Strategic Mistakes |
|---|---|
| Provides rapid extraction of key risk trends, converting qualitative regional events into standardized, quantitative data streams. | Confusing large article volume with actual security risk without confirming the underlying Goldstein scale orientation. |
| Replaces noisy, opinion-heavy journalism with structured semantic insights linked directly to affected industrial sectors. | Over-reacting to short-term text sentiment spikes on smaller, isolated events that don't impact primary supply infrastructure. |
| Enables direct geographic analysis of unfolding conflicts against critical transport links and commodity extraction zones. | Failing to check live transport tracks (AIS/OpenSky) to confirm physical supply chain diversions after a high-risk alert occurs. |
12. Use Cases & Industry Applications
- Energy Derivative Desks: Monitor pipeline infrastructure nodes and refining facilities against local security alerts to manage energy futures positioning.
- Cross-Border Supply Chain Management: Track maritime traffic density and port bottlenecks around key shipping straits to dynamically adjust manufacturing timelines and input sourcing.
- Quantitative Macro Asset Allocation: Integrate quantitative risk values directly into algorithmic trading models to dynamically adjust exposure limits across sensitive currency pairs and sovereign bonds.
- Sovereign Risk Research Teams: Track changes in diplomatic interactions and trade policy metrics alongside local economic conditions to manage long-term direct investments.
14. System Feature Matrix Comparison
| Analytical Capability Parameter | Traditional Media Channels | Stock360s Intelligence Platform |
|---|---|---|
| Data Processing Speed | Manual editorial cycles (Hours to Days) | Algorithmic collection & parsing (Sub-second) |
| Risk Metric Calculation | None (Qualitative descriptions) | Quantitative (Goldstein Scale & Surprise Index) |
| Supply Chain Integration | Retrospective reporting | Live interactive tracking feeds (AIS maritime and OpenSky aviation) |
| Geospatial Analysis | Static maps or text mentions | Dynamic coordinate mapping with multi-layer infrastructure overlays |
15. Semantically Related Concepts
To get the most out of the Geopolitical Event Tracker, it helps to understand these related macroeconomic fields:
- Geopolitical Risk Premium: The additional yield or return required by investors to compensate for the potential impact of political instability on an asset's value.
- Geospatial Entity Resolution: The process of programmatically matching textual descriptions of places in news reports to absolute geographic coordinates ($ Latitude, Longitude $).
- Maritime Chokepoint Vulnerability: Analytical frameworks that assess the economic impact of slowing down traffic through key shipping lanes, such as the Strait of Hormuz, Malacca Strait, or Suez Canal.
- Asymmetric Alpha Generation: Trading strategies designed to capture outsized returns by exploiting information gaps before they are reflected in broader market pricing.
16. Product Integration & Step-by-Step Usage Guide
The Stock360s engine processes, structures, and visualizes complex global datasets through a streamlined user workflow:
- Access the Workspace: Open the primary terminal interface and navigate to the Global Market Intelligence Tracker sidebar module.
- Select Analysis Mode: Choose between Raw Data Mode for complete document visibility, Market Intelligence Mode for risk-scored events, or Live Tracker Mode for logistics monitoring.
- Apply Analytical Filters: Select specific structural categories like Geopolitical Risk, Global Ports, Trade & Shipping, Energy Infrastructure, Agriculture, or Mining Operations.
- Inspect Spatial Markers: Click on any color-coded risk marker on the interactive world map to view the Intel Card tooltip, which contains the event name, Goldstein scale value, narrative summary, and primary source citations.
- Analyze the Intel Box Sidebar: Expand the detailed sidebar view to evaluate the structural market-impact rationale, review historical context, and see recommended watch items.
- Cross-Reference Live Feeds: Switch to the live logistics overlay to verify if aircraft or commercial vessels are changing their tracking routes around the flagged risk zone.
17. Quick Summary
What is the primary function of the Stock360s Geopolitical Event Tracker?
The Stock360s Geopolitical Event Tracker is an automated algorithmic intelligence system that ingests open-source data streams, maritime positions, and aviation feeds to track structural international risks. It maps events geospatially, quantifies diplomatic friction using the Goldstein scale, and identifies under-hedged market catalysts before they reach mainstream financial media networks.
How does the system evaluate and score international event risks?
The platform uses two primary quantitative metrics: the Goldstein Scale and the Surprise Index. The Goldstein scale ranks event actions from -10 (hostile) to +10 (cooperative) based on text sentiment and data types. The Surprise Index flags unusual traffic spikes by comparing real-time article volumes against rolling 30-day historical averages.
What real-time supply chain tracking data sources are integrated?
The platform processes real-time logistics data from the OpenSky Network API for aviation tracking (monitoring cargo and government transport positions) and maritime Automatic Identification System (AIS) data streams to map commercial shipping routes, ports, and international chokepoints.
What are the distinct business-risk levels used on the platform map?
Events are categorized into four business risk levels based on intensity and impact: Critical Risk (Goldstein scores below -7, marking severe systemic shocks), High Risk (-7 to -4), Moderate Risk (-4 to -1), and Low/Positive Risk (scores above +4, indicating de-escalation and cooperation).
How does the platform connect geopolitical events to specific financial asset sectors?
Every event passes through a classification engine that assigns functional tags linking the narrative to affected economic sectors, including energy, logistics, trade, and mining infrastructure. These tags are then connected to regional market indicators like FX volatility and per-capita output to assess financial exposure.
What is Raw Data Mode within the Stock360s platform architecture?
Raw Data Mode is the high-velocity ingestion layer of the tracking system. It focuses on securing complete data coverage by collecting unprocessed text records directly from public registries, news sources, and administrative rss feeds before any semantic interpretation or risk scoring occurs.
What distinguishes Market Intelligence Mode from standard news feeds?
Market Intelligence Mode filters raw information through sentiment models to calculate risk scores, identify story narratives, map spatial coordinates, and add industrial sector tags. This converts unstructured news text into decision-ready data objects within a connected knowledge graph.
How do live maritime AIS tracking feeds create an information edge for traders?
Live maritime tracking gives traders independent confirmation of physical supply chain impacts. By showing actual cargo vessel diversions away from high-risk zones or port bottlenecks in real time, it provides verifiable logistical evidence before those supply shocks affect broader market pricing.
What is the analytical function of the platform's Intel Box sidebar?
The Intel Box sidebar expands automatically when a map marker is clicked. It organizes key details into a structured, easily scannable format, detailing the event narrative, identifying affected industries, outlining the market impact rationale, and providing direct citations back to the source articles.
How should risk managers interpret a high positive Surprise Index score?
A high positive Surprise Index score indicates a statistically significant anomaly in information volume compared to historical baselines. It signals a fast-breaking, unexpected development that has likely not been fully priced into public markets yet, highlighting a potential trading catalyst.
18. Frequently Asked Questions
19. Glossary
20. References
- Goldstein, J. S. (1992). A Conflict-Cooperation Scale for WEIS Events. Journal of Conflict Resolution, 36(2), 369-385.
- OpenSky Network Aviation Telemetry Registry. Data Access Protocol Documentation.
- International Maritime Organization (IMO). International Convention for the Safety of Life at Sea (SOLAS), Chapter V, Regulation 19: Carriage requirements for shipborne navigational systems.
- Stock360s Database Architecture Manual. Semantic Entity Integration and Knowledge Graph Specifications v4.2 (2026).
21. Conclusion
Evaluating geopolitical risk solely through standard retrospective news channels creates an informational disadvantage in fast-moving modern financial markets. The Stock360s Global Market Intelligence Tracker solves this by converting raw, unstructured global event reports into clear, structured data objects. By pairing automated linguistic analysis with real-time maritime AIS and aviation tracking datasets, the platform provides risk managers and traders with an objective, data-driven tool to monitor global supply chain threats and evaluate market catalysts before they impact broad asset pricing structures.