📊 Executive Summary
The Stock360s Stock Screener & Comparator is a dual‑mode analytical tool that transforms raw financial data into actionable investment decisions. In Analysis Mode, users select 2–30 stocks and view a side‑by‑side comparison table of 30+ metrics (profitability, leverage, liquidity, cash flow, growth, risk, efficiency). In Screener Mode, users build logical filters using AND/OR conditions (e.g., ROE ≥ 15% AND Debt/Equity ≤ 0.5) to discover stocks that meet specific investment criteria. The backend uses a pre‑computed database (combined_daily_yearly) that stores the latest annual/quarterly financials per stock, ensuring fast response times and data freshness. Additionally, the tool integrates real‑time news from Google News RSS for up to 3 selected stocks. Built for Indian (IN) and US (US) markets, this screener eliminates manual spreadsheet work and empowers fundamental investors, advisors, and quants to filter, compare, and rank stocks with transparency and speed.
🔑 Key Takeaways
- Two powerful modes: Stock Analysis (compare specific tickers) and Screener (discover stocks by conditions).
- 30+ financial metrics across 7 categories: Profitability, Leverage, Liquidity, Cash Flow, Growth, Risk, Efficiency.
- AND / OR logic – combine up to 10 conditions to build complex screens.
- Latest data only – automatically picks the most recent quarter/year for each stock.
- Sortable comparison tables – click any column header to rank.
- News integration – fetch latest 5 headlines per stock (analysis mode).
- Multi‑market support – screen Indian (NSE/BSE) and US (NYSE/NASDAQ) stocks.
📈 What Is a Stock Screener?
A stock screener is a software tool that allows investors to filter a large universe of stocks based on quantitative criteria. Instead of manually reviewing each company’s financial statements, you define conditions like “Return on Equity (ROE) ≥ 15%” and “Debt‑to‑Equity ≤ 0.5”. The screener returns only those stocks that satisfy all (AND) or any (OR) conditions. Stock360s extends this by also enabling direct peer comparison, real‑time news, and a user‑friendly interface that requires no coding.
🎯 Why It Matters for Indian Investors
With over 5,000 listed stocks on NSE and BSE, finding quality investments is like searching for a needle in a haystack. A screener helps you systematically apply your investment philosophy – value, growth, quality, or low‑risk – and reduces emotional bias. For example, a value investor can screen for “P/E < 15, ROE > 15%, Debt/Equity < 0.5”. A growth investor can look for “Revenue CAGR 3Y > 15% and Net Profit Margin expanding”. The tool also ensures you always compare the latest reported financials, avoiding stale data.
⚙️ How Stock360s Stock Screener Works
The tool has two distinct workflows:
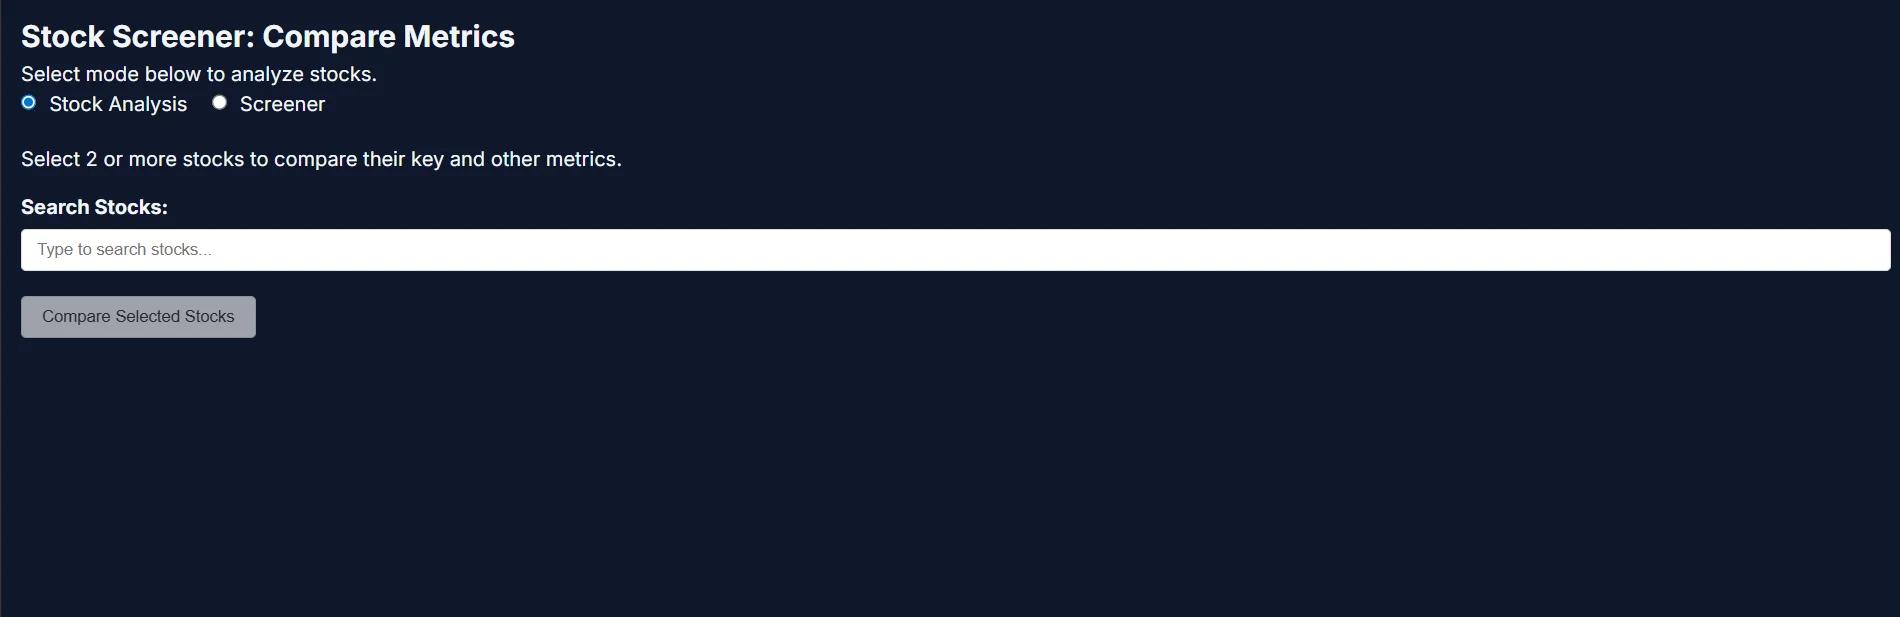
- Analysis Mode: Type a company name or ticker, select checkboxes for 2–30 stocks, and click “Compare”. The system fetches all available financial metrics for those tickers and displays a table where rows are metrics (ROE, Debt/Equity, etc.) and columns are stocks. You can sort any metric row to see which stock performs best. For up to 3 selected stocks, you can expand a news section to read recent headlines.
- Screener Mode: Switch to “Screener” mode and click “+ Add Condition”. For each row, choose a metric (e.g., “ROE”), an operator (≥ or ≤), and a numeric threshold. For subsequent rows, choose AND or OR logic. Click “Run Screener” – the backend evaluates your conditions against the entire stock database, returns the latest record per matching stock, and displays results in a sortable table (stocks as rows, metrics as columns).
🗃️ Data Sources
- Financial statements: NSE/BSE filings, corporate announcements – daily ETL.
- US stocks: SEC EDGAR data via third‑party feeds – updated nightly.
💡 Practical Examples
Example 1 – Value & Quality Screen:
Conditions: ROE ≥ 15% AND Debt/Equity ≤ 0.5 AND Net Profit Margin ≥ 10% AND Current Ratio ≥ 1.5.
Running this screen returns a list of companies that are profitable, have low debt, healthy margins, and good short‑term liquidity. You can then switch to Analysis Mode, select the top 5, and compare their revenue growth and cash flow metrics.
Example 2 – Growth Screen:
Conditions: Revenue CAGR 3Y ≥ 12% AND EPS CAGR 3Y ≥ 10% AND Debt/Equity ≤ 1 (tolerant of moderate leverage).
This identifies consistent compounders. Sort the results by Revenue CAGR descending to see the fastest‑growing companies.
Example 3 – Low‑Risk Defensive Screen:
Conditions: Beta ≤ 0.8 AND Debt/Equity ≤ 0.4 AND Current Ratio ≥ 2.0 AND FCF Yield ≥ 4%.
Good for conservative investors seeking stable cash‑generating businesses.
✅ 10x faster stock discovery
✅ No manual Excel comparisons
✅ Transparent methodology – no black‑box
✅ AND/OR logic for precision
✅ Always uses latest financials
✅ News context for selected stocks
⚠️ Common Mistakes When Using a Stock Screener
- Over‑filtering: Using too many AND conditions may return zero results. Start with 2–3 broad filters and iteratively narrow down.
- Ignoring industry context: A Debt/Equity of 1.5 may be high for a tech company but normal for a utility. Always compare within sectors.
- Using old data: Our system automatically picks the latest record, but if a company hasn't reported for over a year, the data may be stale. Check the “Year” column.
- Misinterpreting ROE: High ROE can come from high leverage, not operational efficiency. Combine with Debt/Equity and ROA.
- Relying solely on screeners: Always do additional due diligence (read reports, listen to earnings calls) before investing.
🏭 Use Cases & Industry Applications
Value investors: Screen for low P/E, high FCF yield, low debt, and consistent margins.
Growth investors: Filter by high revenue/EPS CAGR, expanding margins, and reasonable PEG.
Quantitative analysts: Backtest screen ideas (export results, though export is not built‑in, you can copy tables).
Advisors: Quickly generate a shortlist of stocks matching client risk profiles.
Students: Learn financial ratios by experimenting with different thresholds and observing which companies appear.
🔄 Comparison: Stock360s Screener vs. Popular Alternatives
- vs. Screener.in: Stock360s offers AND/OR logic (not just all‑AND), side‑by‑side comparison of any selected stocks, and news integration. Screener.in focuses on predefined templates.
- vs. TradingView: TradingView is technical‑first; Stock360s is fundamental‑first. Our screener uses 30+ financial ratios, not just price and volume.
- vs. Chartink: Chartink specializes in technical scans; Stock360s excels in financial statement analysis and peer comparison.
🔗 Related Concepts
Fundamental analysis | Ratio analysis | Value investing | Growth investing | Quality investing | Financial statement analysis | Peer comparison | Latest financials – The screener operationalises these concepts by allowing you to convert investment theses into quantifiable filters.
🛠️ How Stock360s Platform Empowers Investors
Stock360s collects, cleans, and normalises financial data from multiple sources (exchange filings, company reports). The ETL pipeline calculates 30+ financial metrics and stores them in a structured database. The screener frontend sends conditions as JSON to the backend, which dynamically builds SQL queries (validated for security) and executes them against the combined_daily_yearly table. The results are then post‑processed to ensure only the latest record per stock is shown. For the Analysis Mode, the system concurrently fetches metrics for each ticker using parallel async requests, reducing latency. News is fetched from Google News RSS, parsed, and cached. All tables are sortable client‑side for a responsive experience. This product‑led approach ensures transparency: every metric is documented, and the filtering logic is fully disclosed.
📘 Step-by-Step Usage Guide
- Access the tool: Go to Stock360s → “Stock Screener” tab.
- Choose mode: “Stock Analysis” (compare specific stocks) or “Screener” (discover stocks).
- For Analysis Mode:
- Type a company name or ticker in the search box.
- Select checkboxes for 2–30 stocks (selected stocks appear as tags).
- Click “Compare Selected Stocks”.
- View the comparison table. Click any metric column header to sort.
- For up to 3 stocks, click “News” to expand latest headlines.
- For Screener Mode:
- Toggle to “Screener” mode.
- Click “+ Add Condition”. Choose a metric, operator (≥ / ≤), and value.
- Add more conditions; for each additional row, select AND or OR.
- Click “Run Screener”.
- Review results table; click any column header to sort.
- Refine conditions as needed.
- Interpret results: Always verify the “Year” column (if shown) to ensure data freshness. Use the comparison mode to dive deeper into shortlisted stocks.
❓ Frequently Asked Questions (50 Essential Q&As)
Up to 30 stocks in Analysis mode.
Only ≥ (greater than or equal) and ≤ (less than or equal).
For each stock, we automatically select the record with the highest year and most recent quarter.
Yes – use the market selector (IN/US) at the top.
The metric is not available for that stock (missing data).
Up to 10 conditions.
Too restrictive – try relaxing thresholds or removing one condition at a time.
Currently not saved; you can bookmark the page and re‑enter.
Daily after market close.
Google News RSS, cached for 10 minutes.
Not directly, but you can copy the table.
Analysis compares selected stocks; Screener discovers stocks by conditions.
Screening focuses on thresholds; exact matches are rarely useful for ratios.
Yes – P/E is part of “Profitability” (or valuation) metrics.
200 stocks per screener query.
Yes – Dividend Yield is available under “Cash Flow” or “Growth”.
Net Income / Shareholders’ Equity – pre‑computed from filings.
Yes, as long as financial data is available.
Yes, the logic selector per row allows mixing (e.g., (A AND B) OR C).
It shows recent headlines; click links to read full articles.
The web tool is responsive; mobile view is supported.
We take the most recent filing date.
Yes – use ≤ 0.
It shouldn’t – if you see duplicates, please contact support.
Compound annual growth rate over 3 or 5 years.
Not automatically, but you can search for peer names manually.
Click on any metric column header (e.g., “ROE”).
Basic screener is free; advanced features (more frequent updates) may require subscription.
Free Cash Flow / Market Capitalisation – cash return relative to price.
Yes – Beta is under “Risk” category.
Each request fetches live RSS; cached for 10 min.
Position of current price relative to 52‑week range – a risk signal.
Yes, the value input accepts decimals.
Not all companies report every metric (e.g., some don’t report interest coverage).
Yes, but note that leverage ratios (Debt/Equity) are calculated differently for banks.
Use YoY margin expansion – check “Net Profit Margin YoY” under Growth.
Click the × on the stock tag.
Quick excludes inventory – more conservative.
Yes, the results table shows the metric values for each stock.
No, this is for stocks only. See our Mutual Fund screener separately.
Refresh the page or clear conditions manually.
Your subscription may have monthly limits; contact support for details.
That metric was not available for that stock.
No, the screener always uses the latest record per stock.
Capital Expenditure / Revenue – indicates reinvestment intensity.
Currently not publicly available.
EBIT / Interest Expense – above 3 is safe, below 1.5 risky.
Yes, Debt/Equity = 0 (use ≤ 0).
Revenue / Total Assets – efficiency of using assets to generate sales.
Hover over metric labels (tooltips) or read our financial metrics blog.
📖 Glossary of Key Stock Metrics
📚 References & Trust Signals
Author: Shailendra Saurav, Stock360s
Reviewed by: Stock360s Research Team – methodology validated against historical data.
Data Disclosures: Financial data sourced from NSE, BSE, and SEC filings. Past performance does not guarantee future returns. Always conduct your own research.
Transparency: All metric formulas and filtering logic are explained above. The screener uses only threshold operators (≥/≤) to avoid false precision.
🎯 Conclusion: Turn Data into Decisions
The Stock360s Stock Screener & Comparator empowers you to systematically filter, compare, and rank stocks using the same financial metrics that professional investors rely on. Whether you're a value investor hunting for bargains, a growth seeker looking for momentum, or a conservative investor prioritising safety, the AND/OR logic and side‑by‑side comparison tables give you clarity and confidence. Start screening today and discover the hidden gems in the market.