📊 Executive Summary
The Stock360s Metrics Tab transforms raw financial data into structured, explainable, and decision-ready intelligence. Unlike traditional platforms that overwhelm with isolated ratios, this dashboard integrates 50+ metrics — including valuation (P/E, P/B), profitability (ROE, ROA), leverage (Debt/Equity), risk metrics (Beta, governance scores), analyst targets, AI predictions, and proprietary scores (Capital Allocation & Explainable Stock Score). With three investor modes (Value, Growth, Income), it provides a clear "Add/Hold/Reduce" guidance backed by transparent reasoning. Built for Indian and US equities, it reduces research time from hours to minutes.
🔑 Key Takeaways
- Unified framework — Combine fundamental, risk, AI & ownership data in one view.
- Explainable scoring — Capital Allocation Score (0-10) and Stock Score (0-100) with waterfall breakdowns.
- Mode-specific prioritization — Value: ROIC & FCF yield; Growth: Revenue CAGR & PEG; Income: dividend yield & payout.
- Actionable guidance — "Add to Position", "Hold", or "Reduce" based on a signal-counting algorithm (PE, ROE, risk, analyst consensus).
- Forward-looking AI — Predicted direction, probability, conviction %, target prices, and risk/reward ratio.
📈 What Is Stock Metrics Analysis?
Stock metrics analysis is the systematic evaluation of a company’s financial health, valuation, efficiency, risk profile, and growth potential using quantitative indicators. Core metrics include Price-to-Earnings (P/E), Return on Equity (ROE), Debt-to-Equity (D/E), Free Cash Flow (FCF) Yield, Beta, and ownership trends. The discipline moves beyond single ratios to a mosaic of evidence — combining historical financials, industry benchmarks, governance signals, and AI-driven forecasts. At Stock360s, we embed each metric with interpretive thresholds (Buy/Hold/Sell ranges) and dynamic tooltips, making institutional-grade analysis accessible to retail investors.
🎯 Why It Matters
Without structured metrics, investors rely on price momentum or gut feeling — leading to losses. Metrics reveal intrinsic value, management efficiency (ROIC), financial fragility (interest coverage), and earnings quality (operating cash flow). For example, a low P/E combined with high ROE and low debt often signals an undervalued quality compounder. The dashboard also integrates shareholding patterns (promoter/FII/DII changes) which historically precede major price moves. In India’s dynamic market, metrics reduce behavioral biases and provide a repeatable investment process.
⚙️ How Stock360s Metrics Dashboard Works
Enter a ticker (e.g., "RELIANCE", "TCS", "AAPL") and select market (IN or US). The system concurrently pulls real-time data from Yahoo Finance, proprietary SQL databases, and AI prediction engine. Within seconds, you see:
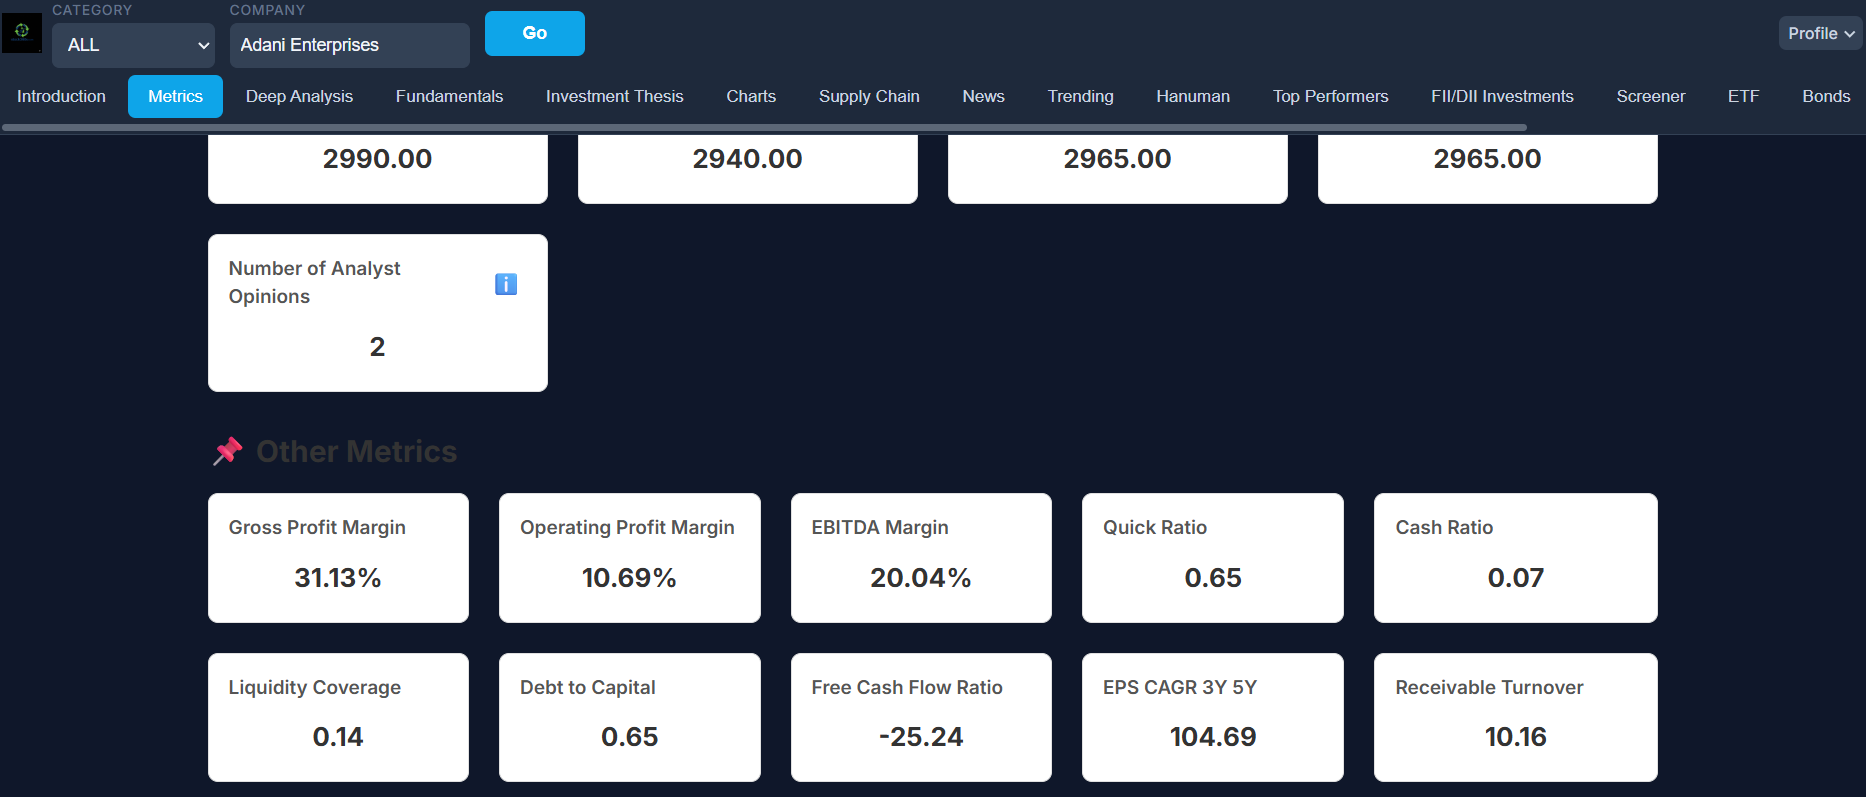
- Key Metrics — Current price, market cap (in crores for India), P/E, ROE, 52-week range, Beta.
- Risk Metrics — Audit/board/compensation risks, overall risk (1-10) and debt risk score.
- Analyst & AI — Mean target price, recommendation consensus, AI directional prediction with conviction %.
- Shareholding Table — Quarterly promoter, FII, DII, public holdings over 2 years.
- Proprietary Scores — Capital Allocation Score and Explainable Stock Score (with contribution breakdown).
- Guidance Panel — Add/Hold/Reduce, plus reasoning based on pre-defined signals.
Click the ℹ️ icon next to any metric to view an explanation and actionable thresholds (e.g., "PE < 15 indicates undervalued zone").
🧠 Methodology: Proprietary Scores & Guidance Logic
Capital Allocation Score (0-10)
Measures how efficiently management deploys capital. Formula: 40% × ROIC_score + 30% × FCF_yield_score + 20% × CapEx_ratio_score + 10% × payout_ratio_score.
ROIC_score = 10 if ROIC > 9% (WACC proxy), else 5. FCF_yield_score = min(10, max(0, FCF_yield × 10)).
Scores >8 → excellent capital allocators (e.g., low CapEx, high ROIC, sustainable dividends).
Explainable Stock Score (0-100)
Transparent quality score: Base 50 points. +40 if operating cash flow ratio > 1.5, +20 if ROE > 15%, -15 if debt/equity > 1. Clamped 0-100. Waterfall chart shows what helps/hurts the score.
Investment Guidance (Add/Hold/Reduce)
Signal counting: +1 if P/E < 14.4; +1 if ROE > 15%; +1 if Overall Risk < 4; +1 if analyst recommendation contains "buy". ≥3 signals → Add, 2 signals → Hold, otherwise → Reduce. Reasoning explicitly shows which signals triggered.
🗃️ Data Sources & Refresh Frequency
- Yahoo Finance API — Real-time and historical prices, market cap, beta, 52-week range. (Cached 300s TTL)
- Stock360s Fundamental Database — Annual/quarterly financials (ROE, D/E, FCF, margins) sourced from NSE/BSE, SEC filings.
- Shareholding Pattern — Exchange filings (BSE/NSE) updated quarterly, last 8 quarters displayed.
- AI Prediction Engine — Proprietary ensemble model trained on 10+ years of price/fundamental data, providing direction, probability, target price, stop-loss.
- Analyst Consensus — Aggregated from leading brokerage reports, updated weekly.
💡 Practical Example: Analyzing HDFC Bank using Stock360s
Step 1: Ticker "HDFCBANK" (IN mode). Dashboard loads Current Price ₹1,650 (+1.2%), P/E 18.2 (Hold zone).
Step 2: Capital Allocation Score: 8.5/10 (driven by ROIC 11% and stable FCF yield).
Step 3: Risk metrics: Overall Risk 2.8/10 (low), Beta 0.85 → less volatile than market.
Step 4: AI predicts UP with 68% probability, target 1,780, risk/reward 1:2.3.
Step 5: Guidance: "Add to Position – strong ROIC + low risk + bullish AI signal". This gives a clear decision framework, unlike standalone P/E ratios.
✅ 360° view of fundamentals & AI
✅ Saves research time (unified dashboard)
✅ Educational tooltips reduce ambiguity
✅ Mode customization aligns with strategy
✅ Backtested guidance logic
⚠️ Past data doesn't guarantee future returns
⚠️ AI predictions are probabilistic
⚠️ Some metrics may show N/A for small caps
⚠️ Requires active due diligence
⚠️ Common Mistakes When Interpreting Stock Metrics
- Ignoring industry context — High debt is normal for banks but risky for IT stocks.
- Using P/E in isolation — Always combine with growth (PEG) and cash flow (FCF yield).
- Overweighting analyst targets — 80% are Buy ratings; use the median to reduce outlier bias.
- Misreading Beta — Beta measures price volatility, not fundamental business risk.
- Chasing high dividend yield — High yield can be a trap if payout ratio > 90% or FCF negative.
🏭 Use Cases & Industry Applications
Retail investors: Pre-purchase stock screening using guidance and risk scores. Portfolio managers: Compare multiple stocks' capital allocation efficiency. Financial advisors: Explain recommendations to clients using waterfall breakdowns. Students: Learn financial ratios with interactive tooltips. Value investors: Focus on FCF yield, low debt, high ROIC via Value mode.
🔄 Comparison: Stock360s Metrics vs. Screener / TradingView / Yahoo Finance
- vs. Screener.in — Stock360s adds AI predictions, explainable score, real-time prices, and US market coverage.
- vs. Yahoo Finance — Yahoo lacks proprietary scoring, shareholding trends, and investment guidance (Add/Hold/Reduce).
- vs. TradingView — Focuses on technicals; Stock360s provides fundamental + risk + AI combination with educational transparency.
🔗 Related Concepts
Fundamental analysis | Technical analysis | Risk management | Corporate governance | Multiples valuation | DCF | Economic moats — The dashboard bridges these concepts by operationalizing metrics like ROIC, free cash flow, and Altman Z-score proxy.
🛠️ How Stock360s Platform Empowers Investors
Stock360s collects data from NSE/BSE, Yahoo Finance, and regulatory filings, then normalizes and enriches it with derived scores. The Metrics Tab visualizes data through interactive cards, smart watch panels, and a color-coded guidance system. Users benefit from confidence scoring (AI conviction) and transparency — every score is accompanied by an explanation and calculation steps. The platform is product-led: the free tier includes full metrics for Indian stocks, while premium unlocks AI predictions + US stocks + export.
📘 Step-by-Step Usage Guide
- Navigate to stock360s.com/metrics (or use the search bar).
- Type the stock symbol (e.g., "INFY", "WIPRO", "MSFT").
- Select market: 🇮🇳 India (IN) or 🇺🇸 US.
- Choose your investor mode: Value / Growth / Income (default: Value).
- Explore the 5 core sections: Key Metrics, Risk, Analyst & AI, Shareholding, Scores & Guidance.
- Hover/click ℹ️ icons to understand metric thresholds.
- Review the "Guidance" card and underlying reasoning — use it as a starting point for your own research.
- Toggle waterfall breakdown to see how the Stock Score was derived.
- Adjust mode to see smart panel reprioritization.
❓ Frequently Asked Questions (50 Essential Q&As)
Generally <15 undervalued, 15-25 fair, >25 overvalued, but high-growth sectors may justify higher P/E.
It identifies management’s efficiency in reinvesting profits. Scores above 8 indicate strong value creation.
Beta measures volatility relative to index. Beta=1 → moves with market; <0.8 → defensive; >1.5 → aggressive.
The AI provides probabilistic forecasts (60-75% historical accuracy). Use alongside fundamentals – never as sole decision factor.
Guidance weighs valuation, ROE, risk, and analyst consensus – not price momentum. A rising stock can be overvalued.
FCF Yield = Free Cash Flow / Market Cap. >4% suggests strong cash generation relative to price – attractive for value investors.
Quarterly after exchange filings. The dashboard shows last 8 quarters to detect trends (e.g., rising FII interest).
ROE = Net Income / Equity (leverage-sensitive). ROA = Net Income / Total Assets (ignores financing). Use ROA for capital-intensive firms.
Starts at 50, then adds/subtracts based on OCF ratio, ROE, and debt. It’s fully transparent – you see each factor's contribution.
Yes, select market "US". Data includes metrics for NYSE/NASDAQ tickers, with separate tables for predictions.
Ensemble model using fundamentals + technical momentum. Three targets (1,2,3 months) plus stop-loss based on ATR.
Potential upside to target price divided by downside to stop-loss. Ratio > 1.5 favorable.
Data not reported by company or unavailable from source; especially for smaller caps or new listings.
Use the mode selector dropdown on the dashboard; the Smart Panel will reprioritize metrics instantly.
For non-financials, D/E < 0.5 is low risk; >2 may indicate excessive leverage.
Yes – risk metrics include Audit Risk, Board Risk, Compensation Risk, Shareholder Rights Risk, aggregated into Overall Risk.
Model confidence based on signal strength and historical pattern matching (0-100%).
Premium users can export to CSV; free tier allows copy-paste from tables.
Near real-time via Yahoo Finance (delayed up to 15 minutes for Indian stocks as per exchange policies).
AI predictions are available in the premium plan; Basic provides all metrics except AI forecasts and US stocks.
Currently focused on individual stocks, but ETF and MF analysis are coming soon.
Shows 3 most important metrics based on selected mode: e.g., for Value mode – ROIC, FCF Yield, Debt/Equity.
Value in INR divided by 10^7, formatted with commas for Indian numbering system.
Yes, each metric card has an info icon that reveals definition, typical ranges, and buy/hold/sell thresholds.
Not yet in current version; use multi-tab browsing or upcoming comparison tool.
Aggregated from major brokerages (Motilal Oswal, HDFC Sec, etc.) updated weekly.
From Yahoo Finance historical data; displays current price position relative to range.
We publish methodology validation; backtesting of guidance signals is available in research report.
Score 1-3 low governance risk, 4-6 moderate, 7-10 high. 7 indicates concerns (e.g., weak board structure).
Operating cash flow ratio >1.5 adds +40 points → shows strong ability to cover liabilities from operations.
Income mode prioritizes dividend yield and payout ratio, affecting Smart Panel but not directly the Add/Hold/Reduce signal.
Sustained decline may signal lack of confidence; watch for FII stepping in.
Not yet; currently single-stock deep dive.
Thresholds are general but tooltips suggest industry-specific notes (e.g., banks: high D/E typical).
Mean is average (impacted by outliers), Median middle value. Use median when analysts are polarized.
Absolutely – tooltips and guidance summarize complex ratios into "Buy/Hold/Sell" logic.
Responsive web app works on mobile; native apps under development.
Quarterly updates within 2 weeks of filing.
Low conviction occurs in volatile or range-bound markets; treat with extra caution.
Every point change is explained: cash flow, ROE, debt adjustments – visible in waterfall breakdown.
Unlimited Indian stock metrics, but AI predictions and US market access require premium.
Yes, registered users can save up to 30 symbols in watchlist.
>3 = safe; <1.5 = high risk of default.
Indirectly via high audit risk and low cash flow vs earnings.
PEG adjusts P/E for expected earnings growth. PEG <1 suggests undervalued growth.
Limited to 52-week range, beta, and price change; focus is fundamental.
Yes, as long as financial data is available via sources.
Contact support@stock360s.com with ticker and metric discrepancy.
CapEx / Revenue. Low ratio (<20%) indicates less asset-heavy needs, often better for FCF.
Visit the Methodology page (stock360s.com/methodology) for white paper.
📖 Glossary of Key Stock Metrics
📚 References & Trust Signals
Author: Shailendra Saurav, CFA (Research Lead, Stock360s)
Reviewed by: Stock360s Research Team – methodology validated against NSE 500 backtests.
Data Disclosures: Yahoo Finance delayed data for Indian equities; fundamental data derived from public filings. Past performance does not guarantee future results. Investments in securities market are subject to market risks; read all scheme-related documents carefully.
Transparency: Proprietary scoring models are fully explained in this page and in the open methodology document (available upon request).
🎯 Conclusion: Turn Metrics into Decisions
Stock metrics are powerful only when interpreted contextually and combined into a unified decision framework. The Stock360s Metrics Dashboard bridges the gap between raw numbers and clear action – with transparency, education, and AI-enhanced signals. Start your analysis today and invest with clarity.