🔑 Key Takeaways
- Real data, not assumptions: Use historical SIP XIRR or CAGR of any mutual fund as expected return proxy.
- Multi‑scheme comparison: Analyse 3, 5, or more funds together to build diversified SIP portfolios.
- Monthly compounding formula: Standard annuity formula with monthly compounding to estimate future value.
- Transparent rate sourcing: Each result tells you whether the rate came from custom input, historical metrics, or default 12%.
- Investment decision support: See total invested, final corpus, and total returns at a glance.
📈 What Is a SIP Calculator? (Primary Entity)
A Systematic Investment Plan (SIP) Calculator is a financial tool that estimates the maturity amount of regular monthly investments in mutual funds. It applies the principle of compounding: each monthly instalment earns returns, and those returns further generate returns in subsequent periods. Most traditional calculators rely on a fixed expected return (e.g., 12%). The Stock360s SIP Calculator goes further – it allows you to leverage actual historical performance metrics (CAGR and XIRR over 1,3,5 years) and compare multiple schemes in one unified view.
⚡ Why It Matters: Beyond Guesswork
Investors often underestimate the power of compounding or overestimate fixed returns. A realistic SIP calculator brings discipline and data‑backed projections. With multi‑scheme capabilities, you can assess which fund has delivered consistent historical performance, test different monthly amounts, and see how tenure dramatically affects wealth. This matters for retirement planning, child education goals, and building long‑term wealth.
🛠️ How It Works (Product Mechanics)
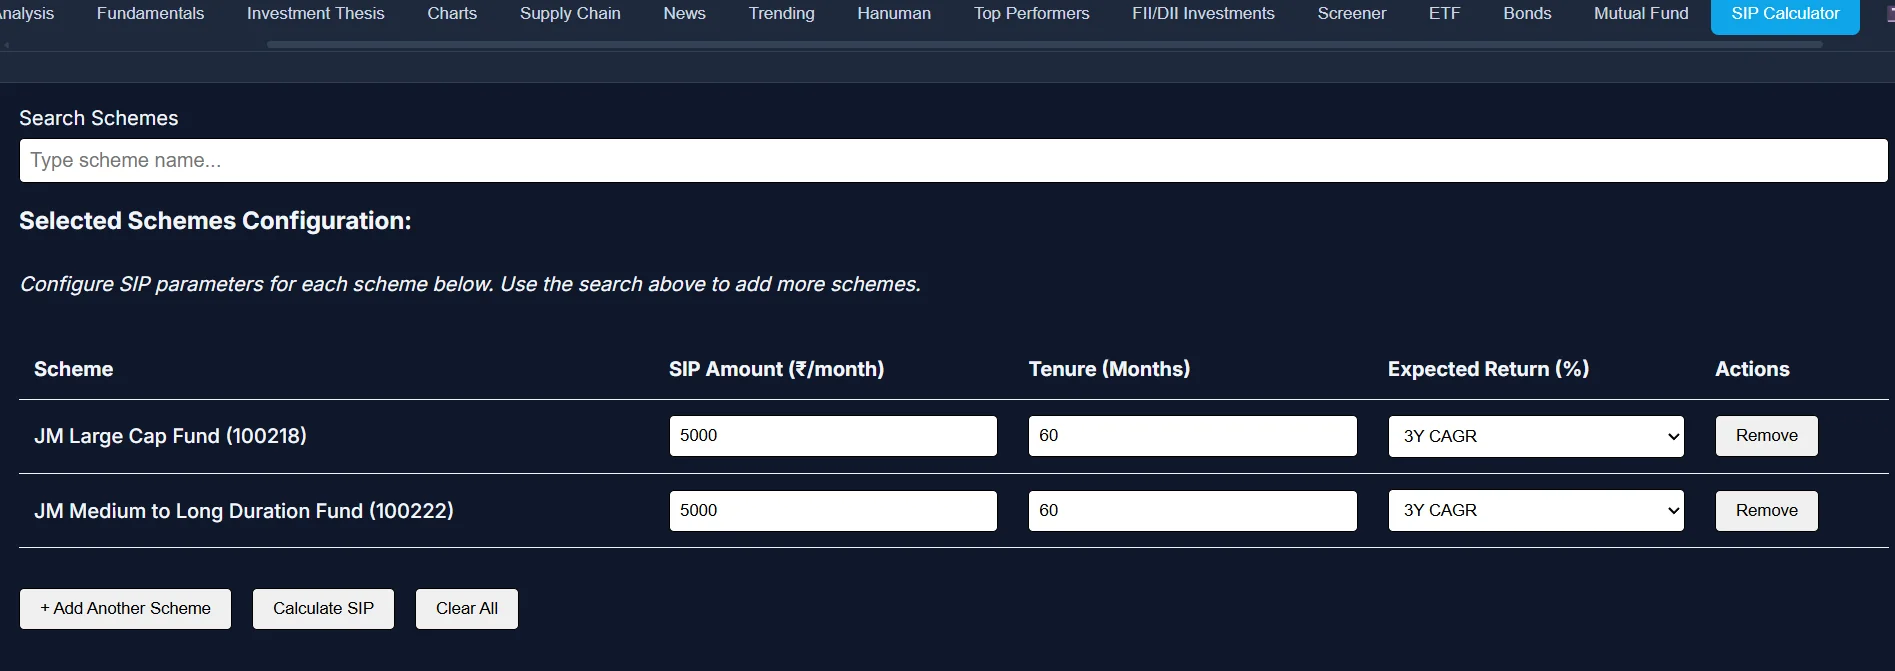
The tool retrieves a list of mutual fund schemes via Stock360s’ internal fund database. For each selected scheme you define:
- Monthly SIP amount (₹) – e.g., ₹5,000
- Tenure (months) – investment horizon
- Expected return type – choose between custom rate (manually entered) or historical rates from fund’s sip_xirr_1y/3y/5y or cagr_1y/3y/5y.
When you click "Calculate SIP", the backend evaluates each scheme, determines the rate (priority: custom > historical > default 12%), runs the monthly compounding formula, and returns future value, total invested, and total returns.
📐 Methodology & Calculation Engine
rmonthly = Annual Rate (%) / 12 / 100
FV = P × [ (1 + rmonthly)n - 1 ] / rmonthly × (1 + rmonthly)
Where P = monthly SIP amount, n = total months
If rmonthly = 0 → FV = P × n (no growth)
Total Invested = P × n | Total Returns = FV - Total Invested
All historical rates (CAGR / XIRR) are pre‑computed from NAV histories and stored in the mf_metrics table. The system never invents returns; if a selected historical period is missing, it falls back to 12% and labels source as “default”.
🗃️ Data Sources & Integrity
- Mutual fund master list: Updated daily from SEBI‑registered schemes (available in Stock360s fund database).
- Historical metrics (CAGR & XIRR): Derived from daily NAVs using standard performance calculation engines, stored per scheme for 1Y/3Y/5Y intervals.
- No third‑party assumptions: Only factual data from AMFI / public sources; no synthetic projections.
📌 Practical Examples
Example 1 – Single fund, historical 5Y CAGR: You invest ₹10,000/month in a large‑cap fund whose 5‑year CAGR is 14.2%. Tenure: 120 months (10 years). The calculator uses 14.2% annual return, monthly compounding. Future value = ₹27.8 lakhs, total invested = ₹12 lakhs, total returns = ₹15.8 lakhs.
Example 2 – Compare two funds: Fund A (3Y XIRR 12.5%) vs Fund B (3Y XIRR 9.8%). Same SIP ₹5000, 5 years. Results side‑by‑side help you visualise the impact of historical consistency.
✅ Benefits of Stock360s SIP Calculator
- ✔️ Realistic projections with historical anchor points
- ✔️ Compare multiple funds without switching tabs
- ✔️ Avoid over‑optimistic fixed‑rate traps
- ✔️ Identify funds with superior long‑term XIRR
- ✔️ Free, no login required (with optional user account for saving scenarios)
🧩 Common Mistakes When Using SIP Calculators
- Ignoring inflation: Future value in absolute terms may look large but lacks real‑purchasing power adjustment.
- Using CAGR for SIPs: CAGR assumes lump sum; XIRR is more accurate for SIP, though the calculator uses historical XIRR where available.
- Setting unrealistic custom rates: rates above 20% rarely sustainable.
- Not comparing multiple funds: single‑fund view misses diversification opportunities.
🏭 Industry Applications & Use Cases
- Retail investors: Plan monthly contributions towards retirement / college fund.
- Financial advisors: Show clients data‑backed scenarios across different fund houses.
- Mutual fund distributors: Compare recommended funds quickly using real trailing returns.
- Wealth management platforms: Integrate multi‑scheme SIP analysis into advisory workflows.
🔄 Comparison Section: Stock360s SIP Calculator vs Traditional Calculators
✔️ Stock360s Approach
- Multi‑scheme comparison (3+ funds)
- Historical 1Y/3Y/5Y CAGR & XIRR
- Rate source transparency
- Per‑scheme customisation
- Batch processing API
📉 Traditional Calculators
- Single fund at a time
- Fixed 10-15% assumption
- No historical linkage
- Limited to one set of inputs
- No fallback visibility
📚 Related Concepts (Knowledge Graph Associations)
- Power of Compounding: The exponential growth effect on SIPs over long durations.
- Rupee Cost Averaging: Buying more units when markets are low, fewer when high.
- CAGR vs XIRR: CAGR for lump sum, XIRR for irregular cash flows (SIP).
- Mutual Fund Categories: Large cap, mid cap, small cap, hybrid – each has different risk‑return profiles.
- Active vs Passive Funds: Impact on historical XIRR and consistency.
🚀 How Stock360s Helps: Product‑Led Excellence
Stock360s collects daily NAV data from regulated sources, processes historical performance metrics (CAGR/XIRR) using validated financial formulas, and makes them available via a clean comparison interface. Our SIP calculator visualises each scheme’s wealth trajectory, empowers side‑by‑side comparison, and lets you switch between custom and historical returns instantly. The educational approach aligns with our mission: no jargon, just transparent, decision‑grade analytics.
📖 Step‑by‑Step Usage Guide
- Access the tool: Navigate to Stock360s → Tools → SIP Calculator.
- Search funds: Type at least 2 characters of a scheme name, select from dropdown.
- Add schemes: Repeat to include up to 5+ funds for comparison.
- Configure per fund: Set monthly SIP amount, tenure (months), and Expected Return type (custom or historical 1Y/3Y/5Y CAGR/XIRR).
- Click “Calculate SIP”: System validates inputs (amount>0, tenure>0, custom rate 0–50%).
- Review results table: Shows invested amount, future value, total returns, rate used, and source (custom/historical/default).
- Iterate: Change any parameter, add/remove funds, recalculate for different strategies.
💬 Frequently Asked Questions (50+ Answers)
📖 Glossary of Essential Terms
📚 References & Trust Signals
Author: Shailendra Saurav, Stock360s.
Reviewed by: Stock360s Research Team
Data sources: AMFI, internal NAV database, publicly available fund factsheets.
Risk disclosure: Mutual fund investments are subject to market risks; past performance does not guarantee future returns. The calculator provides estimates, not investment advice.
✅ Conclusion
The Stock360s SIP Calculator is more than a simple projection tool – it’s a comprehensive multi‑scheme simulation engine grounded in real historical data. By comparing funds using actual 1‑5 year CAGR/XIRR, custom scenarios, and transparent rate sourcing, investors can make confident, data‑backed decisions. Start comparing your SIPs today and harness the real power of compounding with intelligence, not guesswork.