📊 Executive Summary
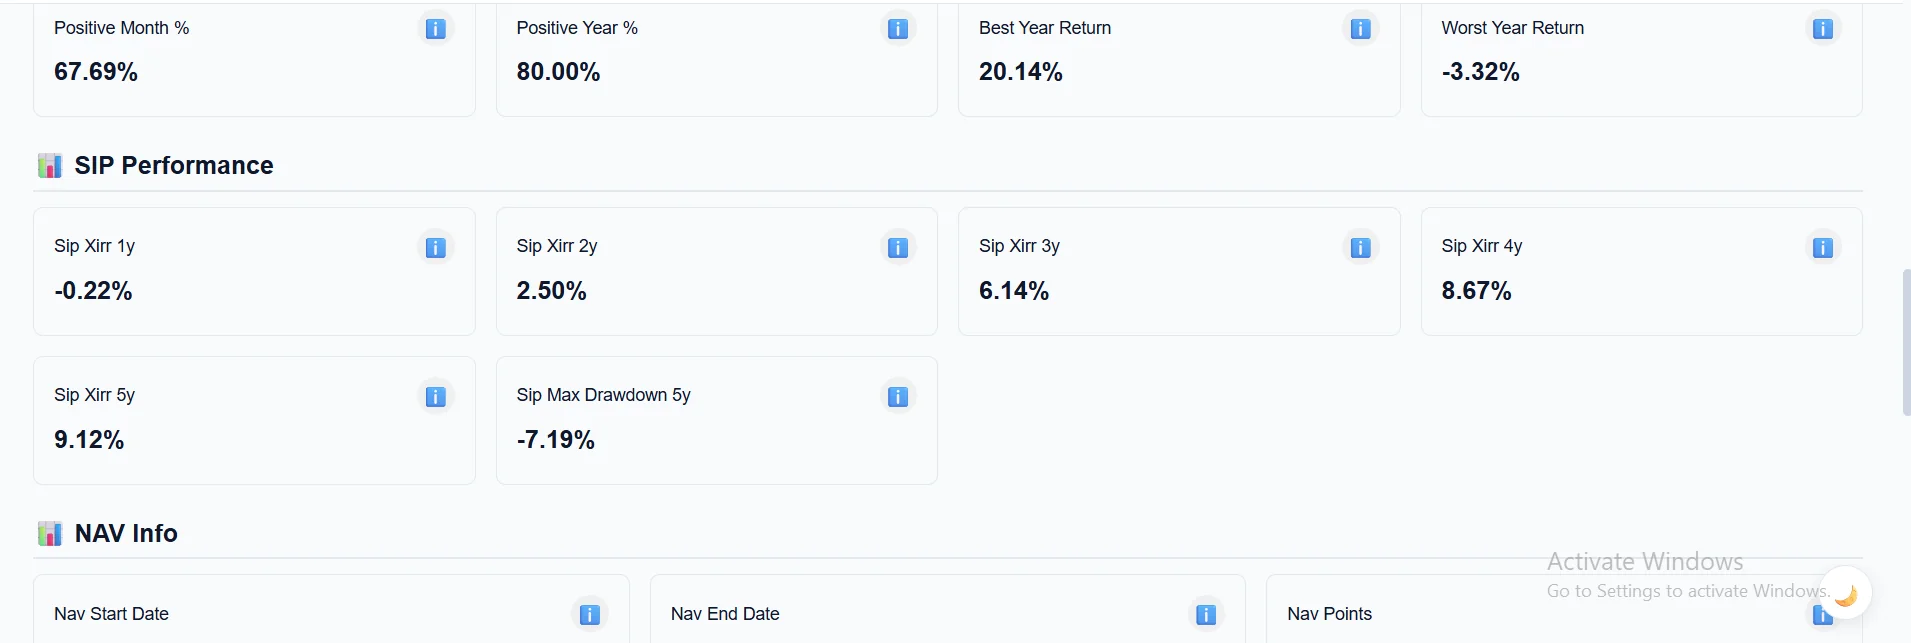
The Stock360s Mutual Fund Screener is an advanced research platform that transforms raw AMFI data into actionable intelligence. Investors can filter funds using dynamic conditions (e.g., CAGR 3Y > 15% AND expense ratio < 1%), sort results by any metric, and compare up to 5 funds side-by-side. The dashboard displays 70+ metrics across 13 logical groups: returns (CAGR, absolute), risk (volatility, max drawdown), risk-adjusted (Sharpe, Sortino), SIP performance (XIRR), costs (expense ratios direct/regular), portfolio concentration, sector allocation, benchmark relation, and suitability (risk level, SIP eligibility). All metrics include tooltips with plain‑English explanations. This eliminates manual spreadsheet work and helps investors make confident, data-driven fund selections.
🔑 Key Takeaways
- Dynamic filtering engine — Use AND/OR logic on 16+ fields (returns, AUM, risk, expense ratio, etc.)
- Side-by-side comparison — Compare 2–5 funds on key metrics in a sortable table.
- Deep fund profiles — 70+ metrics: CAGR, Sharpe, Sortino, SIP XIRR, top holdings, sector allocation, tracking error, information ratio.
- Transparent costs — Direct vs regular expense ratios displayed with difference percentage.
- SIP-focused analytics — SIP XIRR (1–5 years) and SIP max drawdown for monthly investment scenarios.
- Tax & suitability — Tax category, lock‑in period, risk level (Low/Moderate/High), suitable_for_sip flag.
📈 What Is a Mutual Fund Screener?
A mutual fund screener is a software tool that allows investors to filter a large universe of funds based on quantitative criteria. Instead of manually browsing factsheets, you define conditions like “3-year CAGR > 12%”, “expense ratio (direct) < 1.0%”, and “AUM between ₹1,000 Cr and ₹10,000 Cr”. The screener returns only funds matching all (AND) or any (OR) conditions. Stock360s takes this further by also enabling direct fund comparison and displaying rich metric dashboards with educational tooltips.
🎯 Why It Matters for Indian Investors
With over 2,000 open‑ended mutual fund schemes in India, picking the right fund is overwhelming. Returns alone are misleading — a fund with high CAGR may have extreme volatility or poor downside protection. The screener helps you identify funds that align with your risk tolerance (low drawdown, moderate volatility), cost sensitivity (low expense ratio), and investment style (growth, value, tax-saving). By combining filters like Sharpe ratio > 1.2 and max drawdown < -15%, you can build a resilient portfolio that historically weathered market crashes better than the average fund.
⚙️ How Stock360s Mutual Fund Screener Works
Our platform aggregates NAV history, portfolio holdings, and benchmark data for all Indian mutual funds (AMFI recognised). The data is pre‑processed into a single combined_mf table with standardised metrics. The frontend provides two modes:
- Fund Dashboard: Select a fund (by All Funds or by Fund House) to view its 70+ metrics in 13 organised sections. Each metric includes an ℹ️ tooltip explaining its meaning and interpretation.
- Screener & Comparison: Build complex filters (field, operator, value, AND/OR) to narrow down funds, sort results by any column, or switch to “Compare Specific Funds” mode to select 2‑5 funds and see a side‑by‑side table of key performance indicators.
🧠 Methodology: Metrics Calculation & Data Pipeline
Key Metric Formulas (Pre‑computed)
- CAGR (1Y/3Y/5Y): (End NAV / Start NAV)^(1/years) - 1, annualised return.
- Volatility: Annualised standard deviation of daily log returns.
- Maximum Drawdown: Largest peak‑to‑trough decline over the period.
- Sharpe Ratio: (Fund return - Risk free rate) / Volatility. Risk‑free rate = 3‑month T‑bill.
- Sortino Ratio: (Fund return - Risk free rate) / Downside deviation (only negative returns).
- SIP XIRR: Internal rate of return for monthly ₹1,000 SIPs using historical NAVs.
- Tracking Error: Standard deviation of daily excess returns (fund vs benchmark).
- Information Ratio: Excess return over benchmark divided by tracking error.
All calculations are performed by an ETL process updated daily after market close. The screener itself does no live calculations — it retrieves pre‑stored values, ensuring speed and consistency.
🗃️ Data Sources & Refresh Frequency
- NAV History: AMFI daily NAV files (updated every evening).
- Portfolio Holdings: Monthly disclosures from AMCs (typically 15‑day lag).
- Benchmark Indices: NSE/BSE index values (daily).
- Fund Facts (AUM, expense ratio, exit load): Monthly scheme documents.
- Tax & Lock‑in: Static data per scheme based on SEBI categorisation.
💡 Practical Example: Finding a Low‑Risk Large‑Cap Fund for SIP
Step 1: Open Screener tab → “Filter Funds” mode.
Step 2: Add filter: cagr_3y > 12% AND volatility_3y < 15% AND max_drawdown_3y > -12% AND expense_ratio_direct < 1.0% AND suitable_for_sip = Yes.
Step 3: Run screener → returns 23 funds. Sort by “Sharpe 3Y” descending to prioritise risk‑adjusted performance.
Step 4: Select top 3 funds → switch to “Compare Specific Funds” → compare side‑by‑side CAGR, drawdown, expense ratio, and top holdings.
Step 5: Choose the fund with consistent long‑term outperformance and low concentration risk (top 10 holdings < 50%).
✅ 10x faster fund research
✅ No more manual Excel comparisons
✅ Educational tooltips for beginners
✅ Customised filters for any strategy (growth, tax, income)
✅ Transparent methodology – all formulas disclosed
⚠️ Common Mistakes When Using a Mutual Fund Screener
- Over‑optimising on past returns: A fund that ranked #1 last year often underperforms the next year (reversion to mean). Include consistency filters like “positive years % > 80%”.
- Ignoring expense ratios: A difference of 0.5% in expense ratio can erode 10% of your final corpus over 20 years. Always filter for low-cost direct plans.
- Misusing Sharpe ratio for debt funds: Sharpe penalises all volatility; for debt funds, use Sortino or yield‑based metrics.
- Forgetting exit loads: A fund with no exit load may encourage short‑term holding, but if you intend to stay long, it’s fine. Check the exit load structure.
- Comparing funds from different categories: Don’t compare a small‑cap fund (high volatility) with a large‑cap fund. Always filter by category or use benchmark‑relative metrics (information ratio).
🏭 Use Cases & Industry Applications
Retail investors: Build a diversified portfolio by screening for different risk profiles (conservative, moderate, aggressive). Financial advisors: Quickly generate fund shortlists for clients based on age, risk tolerance, and tax situation. Wealth managers: Compare multiple funds across AMCs to identify consistent outperformance. DIY researchers: Export screener results to CSV for further analysis (premium feature).
🔄 Comparison: Stock360s Screener vs. Popular Alternatives
- vs. Value Research Online: Stock360s offers dynamic AND/OR logic (not just presets), side‑by‑side comparison of any funds, and 70+ metrics including SIP XIRR and tracking error.
- vs. Morningstar India: Morningstar requires paid subscription for advanced filters; Stock360s provides free access to screener with basic metrics (premium for CSV export and AI recommendations).
- vs. Groww / Coin by Zerodha: Those platforms focus on transaction; Stock360s provides deep analytics and custom filter building, not just a list of popular funds.
🔗 Related Concepts
Systematic Investment Plan (SIP) | XIRR | Asset Allocation | Active vs Passive Investing | Rolling Returns | Alpha & Beta | Expense Ratio Impact | Tax Harvesting | ELSS | Index Funds — The screener helps operationalise these concepts by letting you filter for funds with high rolling return consistency, low tracking error (for passive funds), or specific tax categories.
🛠️ How Stock360s Platform Empowers Investors
Stock360s collects and normalises data from AMFI, AMC disclosures, and NSE/BSE indices. Our proprietary ETL pipeline calculates 70+ metrics, storing them in a structured database. The frontend screener uses an in‑memory evaluation engine to apply user‑defined filters (including LIKE operator for text fields) and returns results instantly. For comparison mode, we fetch pre‑computed metrics for selected scheme codes and render a table with sortable columns. All tooltips are curated by our research team and updated as new metrics are added. This product‑led approach ensures transparency – every score and filter is explained, and no black‑box algorithms hide behind the numbers.
📘 Step-by-Step Usage Guide (Screener)
- Navigate to Mutual Fund tab → click Screener sub‑tab.
- Choose Filter Funds mode (default).
- Click + Add Filter. Select a field (e.g., cagr_3y), operator (>), and value (0.15 for 15%).
- Add more filters with AND/OR join logic.
- Click Run Screener – see results table.
- Click any column header (e.g., “AUM (₹ Cr)”) to sort ascending/descending.
- To compare specific funds, switch to Compare Specific Funds mode, add up to 5 funds via dropdowns, and click Compare Selected.
- Review side‑by‑side table and decide which fund aligns with your strategy.
❓ Frequently Asked Questions (50 Essential Q&As)
Yes, use field “aum_crores” with operators >, <, between.
CAGR annualises returns; absolute return is total gain over period.
Filter expense_ratio_direct < 0.01 (for 1%).
Yes, filter tax_category = "ELSS".
Yes – SIP XIRR 1Y,3Y,5Y and SIP max drawdown 5Y are available.
Above 1.0 is acceptable, above 1.5 is very good.
Monthly, typically 2‑3 weeks after month end.
Yes, comparison mode works across any funds.
Fund allows monthly SIP investments (most open‑ended funds).
Use volatility_3y < 0.12 (12%).
Measures how closely a fund follows its benchmark – low for index funds.
Premium users can export to CSV.
Yes, all categories including liquid, ultra‑short, corporate bond, gilt.
Worst portfolio value decline during a 5‑year monthly SIP.
Based on volatility and max drawdown percentiles within category.
Yes, using “fund_manager” field with LIKE operator.
Percentage of years where fund had positive returns – shows consistency.
Yes, each scheme code corresponds to either direct or regular plan.
Filter top_10_holdings_pct < 40%.
Yes, fully responsive design.
Yes, using exit_load text field (LIKE ‘1%’).
Each fund has its designated benchmark (e.g., NIFTY 50, NIFTY Midcap 100).
Filter information_ratio > 0.5 (positive active return per unit of risk).
Up to 10 filters per query.
Yes, in the fund metrics dashboard under Portfolio section.
% of fund returns explained by benchmark – high R‑squared means fund behaves like benchmark.
Higher is better, focuses only on downside volatility – useful for conservative investors.
Only open‑ended funds (continuous NAV).
Yes, use inception_date field with operators like > ‘2015-01-01’.
Direct plan has no distributor commission, hence lower expense ratio.
Not currently, but most funds accept ₹500 SIP.
Rows with null values are excluded from that filter condition, but still shown if other filters match.
Yes, use “aum_category” field (e.g., ‘Large Cap’, ‘Mid Cap’).
Not yet, but planned for next release.
Filter 5Y CAGR > 12%, max drawdown > -25%, and consistency positive years > 80%.
Comparison table includes top holdings and sector allocation for each fund.
Currently only Indian mutual funds (AMFI).
Brokerage and exchange fees – included in expense ratio indirectly.
Look for information ratio > 0.3 over 5 years and low tracking error.
Coming soon – user accounts will save custom screens.
High cash may indicate defensive positioning or inability to deploy funds.
Filter exit_load LIKE ‘0%’ or ‘Nil’.
Not yet, but we plan to add manager experience metrics.
Yes, dividend_option_available = Yes/No.
Generally < ₹15,000 Cr to maintain flexibility.
SIP XIRR accounts for phased investments; in rising markets lump sum CAGR > SIP XIRR.
Yes, use “Fund House” filter then add to comparison.
Tooltips are in the fund dashboard; in screener, hover over column headers for descriptions.
Daily after market close.
In our “Methodology” section above and in the research white paper (downloadable).
📖 Glossary of Mutual Fund Terms
📚 References & Trust Signals
Author: Shailendra Saurav, Stock360s
Reviewed by: Stock360s Research Team – methodology validated against historical fund data.
Data Disclosures: Fund data sourced from AMFI, AMC monthly portfolios, and NSE/BSE. Past performance does not guarantee future returns. Investors should read scheme information documents before investing.
Transparency: All metric formulas are disclosed above. The screener does not use proprietary black‑box scoring; every filter condition is user‑controlled.
🎯 Conclusion: Turn Fund Data into Decisions
The Stock360s Mutual Fund Screener eliminates guesswork and manual effort. Whether you are a first‑time SIP investor or a seasoned advisor, you can filter, compare, and analyse funds with confidence. Use the dynamic filter engine to match your risk profile, compare side‑by‑side to see the full picture, and always check the tooltips to understand what each number means. Start screening today and build a smarter mutual fund portfolio.