📌 Executive Summary
ETF analysis is the process of evaluating an exchange‑traded fund beyond its name and index. The three most critical metrics for Indian investors are: tracking error (how closely the ETF follows its index), liquidity/impact cost (the cost to buy or sell without moving the price), and underlying index construction (smart beta vs market‑cap weighted). Using a dedicated tool like Stock360s ETF dashboard, you can compare these metrics live, view 30+ technical indicators (52‑week range, moving averages, volume), and get educational tooltips – all for both Indian (NSE) and US markets.
📌 Key Takeaways
- ✅ Tracking error > 0.5% can significantly erode long‑term returns – always compare with expense ratio.
- ✅ Impact cost (liquidity) matters more for large trades; check average daily volume before investing ₹1 lakh+.
- ✅ Smart beta ETFs (momentum, low volatility) are not inherently better – they perform differently in market cycles.
- ✅ Stock360s provides real‑time live price (30‑sec cache from Yahoo Finance) plus historical metrics (50/200 MA, 52‑week range, P/E, EPS) in one dashboard.
- ✅ Use the “By Company” filter to compare ETFs from the same AMC (e.g., all Nippon India ETFs).
1. What Is ETF Analysis?
ETF analysis is the practice of examining a fund’s structure, costs, trading characteristics, and underlying holdings to determine if it fits your investment strategy. Unlike mutual funds, ETFs trade on an exchange like stocks, so liquidity and market price become as important as the fund’s NAV. Proper analysis helps you avoid hidden costs (tracking error, impact cost) and choose the right index exposure.
2. Why ETF Analysis Matters for Indian Investors
India’s ETF market has grown rapidly, but not all ETFs are equal. Some have low AUM and low volume, making them difficult to sell without paying a high impact cost. Others suffer from poor replication, leading to tracking errors that can exceed the expense ratio. By analyzing these metrics, you protect your returns and avoid illiquid traps.
3. How ETF Analysis Works – Core Metrics
3.1 Tracking Error
Definition: Standard deviation of the difference between ETF returns and index returns. A lower tracking error means the ETF faithfully mirrors the index. In India, tracking error of 0.2%–0.5% is acceptable for large Nifty ETFs; above 1% is poor.
Why it matters: Even 0.5% extra drag over 10 years reduces final corpus by ~5% due to compounding.
3.2 Liquidity (Impact Cost & Volume)
Impact cost is the cost of executing a trade relative to the ideal price. For example, if you want to buy ₹10 lakh of an ETF, and the best buy/sell prices move unfavorably by 0.3%, that’s your impact cost. Check average daily volume (10‑day and 3‑month) on Stock360s – funds with volume < ₹1 crore daily may be illiquid.
3.3 Expense Ratio vs AUM
A lower expense ratio is good, but not if the ETF has tiny AUM (assets under management). Small AUM ETFs face higher chances of closure or wider spreads. Look for AUM > ₹100 crore for comfort.
3.4 Smart Beta vs Plain Vanilla
Plain vanilla ETFs track market‑cap weighted indices (Nifty 50, Sensex). Smart beta ETFs follow factor‑based rules: momentum (buy recent winners), low volatility (defensive stocks), quality (high ROE). These can outperform in certain market phases but underperform in others.
3.5 Technical Indicators (52‑week range, Moving Averages)
Even long‑term ETF investors benefit from knowing if the ETF is near its 52‑week high (potential resistance) or low (support). The 50‑day and 200‑day moving averages help identify trends – when price is above both, the uptrend is strong.
4. Practical Example: Analyzing NIFTYBEES on Stock360s
Step 1 – Open ETF tab: Navigate to the Stock360s ETF dashboard. Ensure market is set to “IN”.
Step 2 – Filter by Company: Select “By Company” → choose “Nippon India”.
Step 3 – Select ETF: Pick “NIFTY ETF” (symbol NIFTYBEES).
Step 4 – Scan metrics:
- ETF Overview: current_price = ₹245.30, marketState = OPEN.
- Day Performance: open = ₹240.00, dayHigh = ₹250.00 → price moved up (green text).
- Volume: regularMarketVolume = 12,00,000 shares; averageDailyVolume10Day = 9,00,000 → current volume 33% above average → high interest.
- Moving Averages: price (₹245) above 50‑day (₹230) and 200‑day (₹210) → strong uptrend.
- 52‑Week Range: 52‑week high = ₹260, low = ₹180; current price at 65% of range – not overbought.
Conclusion: NIFTYBEES is liquid, trending up, and reasonably priced within its 52‑week band – suitable for both SIP and lump sum.
6. Step‑by‑Step Usage Guide – Stock360s ETF Dashboard
- Access the ETF tab – click “ETF” in the main navigation.
- Market context – the dashboard inherits your current market (US/IN) from the global selector (top‑right).
- Choose filter – “All ETFs” shows every ETF; “By Company” reveals an AMC dropdown.
- Select AMC (if applicable) – e.g., “HDFC”, “ICICI Prudential”, “Nippon India”.
- Pick an ETF – from the dynamically populated dropdown.
- Review metrics groups:
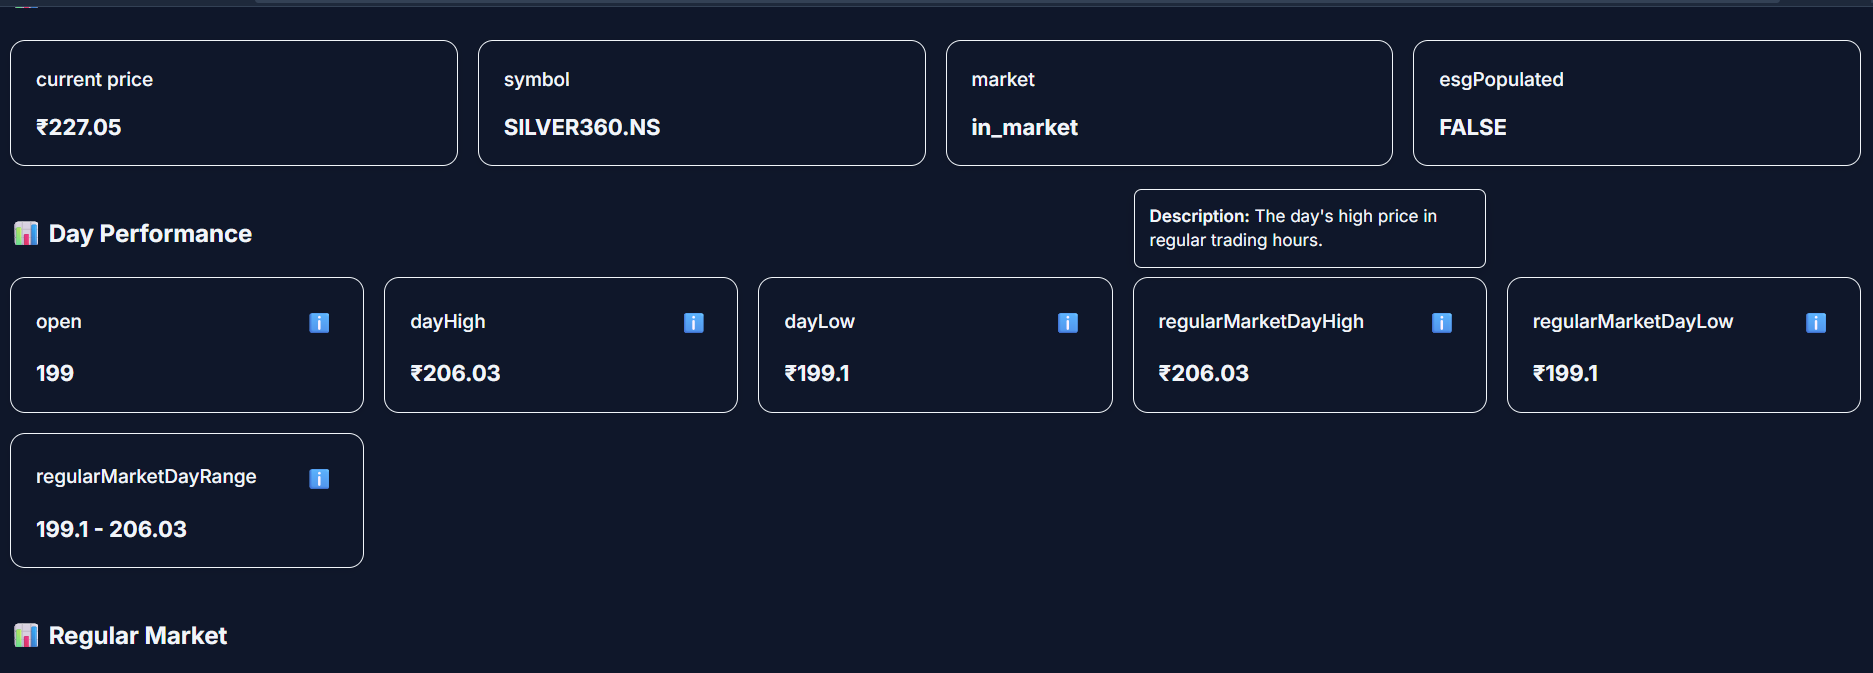
- 📊 ETF Overview: short name, market, ESG flag
- 📈 Day Performance: open, day high/low
- 💰 Regular Market: current price, change, change%
- 📦 Volume: current volume vs 10‑day/3‑month averages
- 📉 Moving Averages: 50‑day and 200‑day with changes
- 📅 52‑Week Range: high/low, change, percent from extremes
- 🏆 All‑Time Extremes: historical high/low
- 💹 Trading Info: bid, ask, marketState, trailing P/E, EPS
- Use tooltips – click the ℹ️ icon on any metric card to read a plain‑English explanation.
- Compare – simply select a different ETF from the dropdown; the dashboard updates instantly.
7. Benefits of Using Stock360s for ETF Research
- ✔ All‑in‑one dashboard – no need to switch between Yahoo Finance, NSE India, and AMC websites.
- ✔ Educational tooltips – demystify 30+ financial terms, perfect for beginners.
- ✔ Real‑time price with 30‑sec cache – balance of freshness and performance.
- ✔ US & Indian markets – unified interface for global diversification.
- ✔ Color‑coded signals – green when price > open (positive momentum), red when below.
- ✔ No manual symbol adjustments – automatic .NS handling for Indian ETFs.
9. Common Mistakes When Analyzing ETFs (and How to Avoid)
- Mistake: Buying an ETF just because it has a low expense ratio, ignoring low liquidity.
Fix: Always check average daily volume (10‑day) on Stock360s; if it’s below ₹1 crore, reconsider. - Mistake: Assuming an ETF near its 52‑week low is a bargain.
Fix: Look at the reason for decline – index may be in a structural downtrend. Use 200‑day moving average as filter. - Mistake: Confusing “regularMarketPrice” with “current_price”.
Fix: On Stock360s, “current_price” is the live Yahoo feed; “regularMarketPrice” is the last closing price from the database. Use current_price for trading decisions. - Mistake: Overlooking marketState (OPEN/CLOSED/PRE/POST).
Fix: If marketState is CLOSED, your order will not execute until the next session. Check before trading.
10. Use Cases & Industry Applications
- Retirement portfolio construction: Use low‑volatility ETFs (smart beta) for defensive allocation.
- Active trading: Monitor volume spikes and 52‑week breakouts using the real‑time dashboard.
- Financial advisory: Show clients the impact cost of their suggested ETFs to justify recommendations.
- Research & education: Use the tooltips to teach students what P/E, EPS, and moving averages mean for ETFs.
11. Comparison Section
US vs Indian ETF Analysis
| Aspect | US ETFs | Indian ETFs |
|---|---|---|
| Currency & formatting | $ (K/M/B/T) | ₹ (L/Cr) |
| Trading hours (local) | 9:30–16:00 ET | 9:15–15:30 IST |
| Typical tracking error | 0.02%–0.10% | 0.10%–0.50% |
| Liquidity (large ETFs) | Very high (millions shares/day) | Moderate to high (lakhs shares/day) |
| Smart beta availability | Wide (momentum, quality, low vol) | Growing (Nippon, ICICI, Motilal Oswal) |
High Volume vs Low Volume ETFs
| Factor | High Volume (>10 lakh shares/day) | Low Volume (<1 lakh shares/day) |
|---|---|---|
| Impact cost | Low (<0.05%) | High (>0.5%) |
| Bid‑ask spread | Tight (₹0.05–0.10) | Wide (₹0.50–2.00) |
| Best for | Large trades, active trading | Long‑term buy‑and‑hold, small amounts |
12. Related Concepts & Prerequisite Knowledge
- Mutual Fund Analysis – understand how ETFs differ from active funds.
- Bond Risk & Credit Quality – for fixed‑income ETFs.
- SIP Strategy – how to systematically invest in ETFs.
- Financial Metrics Glossary – P/E, EPS, ROE explained.
13. How Stock360s Helps – Product‑Led Explanation
Stock360s is not just a data aggregator; we build tools that explain as they show. The ETF dashboard includes:
- Tooltips for every metric – written by financial analysts, not generic definitions.
- AMC filtering – compare all ETFs from a single fund house to spot the best expense ratio or tracking record.
- Live price with 30‑second cache – ensures you never act on stale data while respecting API limits.
- Automatic market formatting – ₹/L/Cr for India, $/K/M/B/T for US – no mental conversion needed.
To experience it, click the “Launch Demo” button below or navigate to the ETF tab after logging in.
14. Frequently Asked Questions (50 FAQs)
15. Glossary of ETF Metrics (30+ Terms)
Tracking Error: Standard deviation of the difference between ETF returns and index returns. Lower is better.
Impact Cost: Cost to execute a trade relative to ideal price, reflecting liquidity.
All-Time High: Highest price the ETF has ever reached – a psychological resistance.
All-Time Low: Lowest price ever – potential support.
52-Week High/Low: Highest/lowest price in the last year.
50-Day Moving Average: Average closing price over 50 trading days (≈10 weeks).
200-Day Moving Average: Long‑term trend indicator (≈10 months).
Bid: Price a buyer is willing to pay.
Ask: Price a seller is willing to accept.
Volume: Number of shares traded today.
Average Daily Volume (10D/3M): Baseline trading activity for comparison.
Trailing P/E: Price divided by earnings per share over last 12 months.
EPS (Trailing Twelve Months): Earnings per share of the underlying portfolio.
Market State: OPEN, CLOSED, PRE (pre‑market), POST (after‑hours).
ESG Populated: Indicates that Environmental, Social, Governance data is available for the ETF’s holdings.
Smart Beta: Index construction using factors like momentum, low volatility, or quality instead of market cap.
Expense Ratio: Annual fee charged by the AMC as a percentage of AUM.
AUM (Assets Under Management): Total value of assets held by the ETF.
16. References & Data Source Disclosures
- Yahoo Finance – real‑time price feed (lastPrice). https://finance.yahoo.com/
- NSE India – historical data for Indian ETFs (source for internal database).
- Stock360s internal calculations: none – all metrics are sourced directly from data vendors or pre‑computed in the database.
- Tooltips written by Stock360s research team based on SEBI and SEC definitions.
17. Conclusion & Next Steps
ETF analysis is not optional – it protects you from hidden costs and helps you select the right fund for your goals. Use the three pillars: tracking error, liquidity (impact cost), and index construction (smart beta vs plain vanilla). Then leverage the Stock360s ETF dashboard to apply these concepts live. Start by exploring the demo or logging in to see real data.