Executive Summary
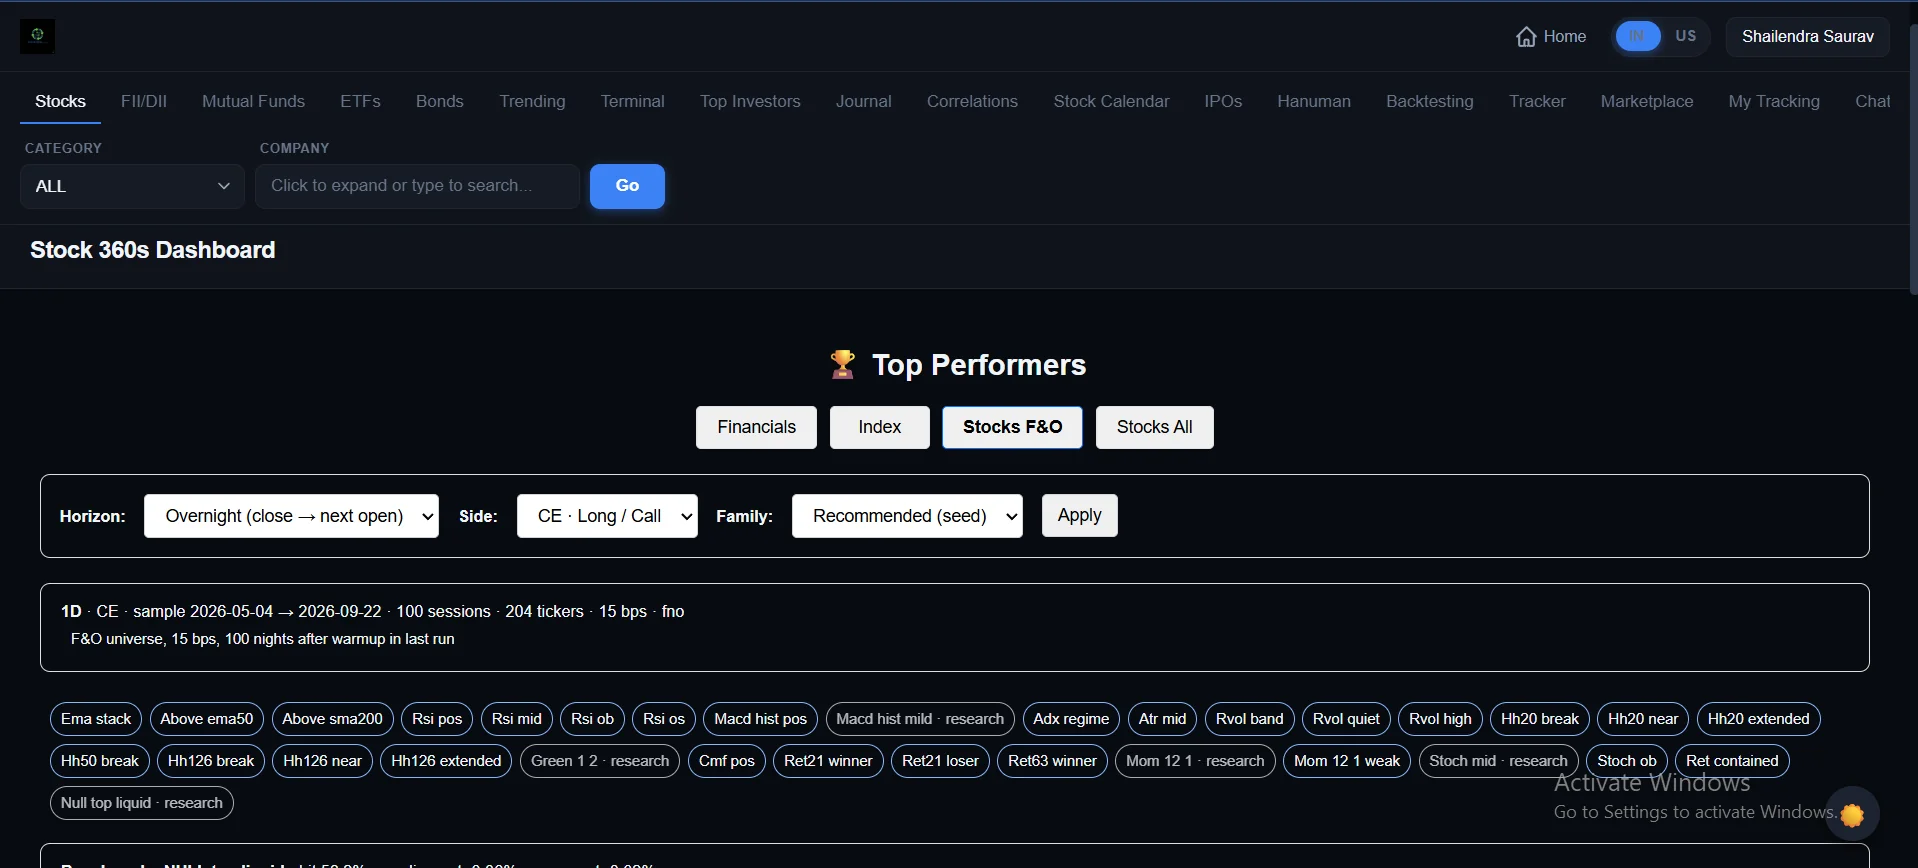
The Top Performers feature on Stock360s converts complex financial data into an easy‑to‑use ranking system. Instead of juggling dozens of ratios, you get 7 category scores (Profitability, Liquidity, Leverage, Cash Flow, Growth, Risk, Efficiency), an overall composite score, and quarterly momentum rankings. You can filter by sector/industry, toggle between best and worst performers, and identify both market leaders and potential red flags – all without building your own models.
Key Takeaways
- ✅ 7 categories cover all major aspects of financial health.
- ✅ Overall Top 10 – stocks with the highest average composite score.
- ✅ Category Best/Worst 5 – see who leads or lags in each dimension.
- ✅ Quarterly Difference – stocks showing the biggest improvement (turnaround candidates).
- ✅ Quarterly Absolute – stocks with the strongest raw quarterly performance.
- ✅ Sector/Industry Filters – compare only peers within the same industry.
- ✅ No manual configuration – scores are pre‑computed and ready to use.
What Is the Top Performers Ranking System?
The Top Performers system is a multi-factor stock ranking engine that evaluates companies using pre‑computed scores across 7 financial dimensions. It answers the question: “Which stocks are financially strongest or weakest, right now?” The system is not a black box – the scores are derived from standard financial metrics (e.g., ROE, Debt-to-Equity, Revenue Growth) and updated after each annual and quarterly report.
Why This Ranking Matters for Investors
Investors waste hours comparing companies on inconsistent metrics. One stock may have high ROE but also high debt; another may have strong growth but poor cash flow. The Top Performers system normalizes these trade-offs by providing a single score per category and an overall average. This allows you to:
- Quickly identify quality leaders in any sector.
- Spot red flags (companies that rank consistently in “Worst 5” across multiple categories).
- Find turnaround candidates via quarterly difference scores.
- Compare peer groups using sector/industry filters.
How the Ranking Works – Methodology
Data Sources & Update Frequency
The system uses two main database tables:
- combined_daily_yearly (or combined_daily_yearly_us for US markets) – contains annual financial data and pre‑computed category scores for each company’s latest fiscal year.
- top_performer_quarter (or top_performer_quarter_us) – contains quarterly scores, including
total_diff_score(quarter‑over‑quarter improvement) andtotal_quarter_score(absolute quarterly performance).
Pre‑computed Scores vs Raw Metrics
The backend API (/api/stock/analysis) first tries to use pre‑computed category scores (e.g., Profitability_Score, Liquidity_Score, etc.). If these columns are missing from the database for a particular category, the system falls back to a ranking based on raw metrics defined in the METRIC_CATEGORIES dictionary (see table below). The fallback logic is not detailed in the code but is implemented in compute_category_top and compute_overall_top functions.
The 7 Categories Explained
Profitability
Gross Margin, Operating Margin, Net Margin, ROE, ROA, EBITDA Margin, Margin Trend.
Liquidity
Current Ratio, Quick Ratio, Cash Ratio, Liquidity Coverage.
Leverage
Debt-to-Equity, Debt-to-Capital, Interest Coverage, Debt-to-EBITDA, Altman Z-Score.
Cash Flow
Operating Cash Flow Ratio, Free Cash Flow Ratio, CapEx Ratio, Cash Conversion, FCF Yield.
Growth
Revenue CAGR (3Y/5Y), EPS CAGR, Net Income CAGR, YoY Growth.
Risk
52‑Week High/Low Position, Debt Risk, Upside from 52‑Week Low.
Efficiency
Inventory Turnover, Receivable Turnover, Asset Turnover.
Overall Composite Score (Average)
The Average_Score for each stock is calculated as:
Average_Score = (Profitability_Score + Liquidity_Score + Leverage_Score + CashFlow_Score + Growth_Score + Risk_Score + Efficiency_Score) / (number of non‑null scores)
If a category score is missing (null), it is excluded from the average. The overall top 10 are the stocks with the highest Average_Score after applying sector/industry filters.
Quarterly Momentum (Difference vs Absolute)
- Quarterly Difference (
total_diff_score) – Measures the magnitude of improvement or deterioration from the previous quarter. A high positive score indicates strong momentum (turnaround). - Quarterly Absolute (
total_quarter_score) – Measures raw performance in the latest quarter, regardless of prior quarter. High scores indicate consistent strength.
Both scores are pre‑computed and stored in the quarterly table. The API returns the top 10 and worst 10 for each.
Lower‑is‑Better Handling
For certain metrics (e.g., Debt-to-Equity, PE Ratio, Risk scores), a lower value is better. The ranking logic automatically inverts the order when computing “best” performers. The metrics with this flag are defined in LOWER_IS_BETTER.
Fallback Ranking Logic
If a category score column is missing, the system uses the raw metrics listed in METRIC_CATEGORIES[category] to compute a composite ranking. The exact formula (e.g., z‑score sum, percentile ranking) is not provided in the code, but the result is a numeric score used to sort stocks.
Step-by-Step Guide: Using the Top Performers Dashboard
- Access the feature – Navigate to the “Analysis” section on Stock360s and click “Top Performers”.
- Review overall top 10 – Expand the “🏆 Overall Top Performers” section. You’ll see stocks with the highest Average_Score, their company name, ticker, and the average score.
- Explore category strengths – Expand any category (e.g., “Profitability”). Use the “Best 5” / “Worst 5” toggle buttons to see leaders and laggards in that dimension. Each table shows the category score and a few relevant raw metrics.
- Check quarterly momentum – Expand the “📈 Quarterly Performers (Difference)” and “📊 Quarterly Performers (Absolute)” sections. Toggle between Best 10 and Worst 10 to see which companies are improving or deteriorating.
- Apply filters – Use the Sector and Industry dropdowns, then click Apply. All tables (overall, categories, quarterly) update to show only stocks in the selected sector/industry.
- Make investment decisions – Use the rankings to shortlist strong companies for further research, or avoid those appearing repeatedly in “Worst 5”.
Practical Example: Analyzing a Real Stock Cohort
Assume you apply a filter for the Technology sector. The system might show:
- Overall Top 10 – Infosys (Average_Score 92.4), TCS (89.1), HCL Tech (85.6), etc.
- Profitability Best 5 – Infosys (Profitability_Score 95), TCS (93), Tech Mahindra (88) – all high margins.
- Leverage Best 5 – Low-debt companies like TCS (score 98) vs worst 5 showing high leverage.
- Quarterly Difference Best 10 – A mid‑cap IT stock that improved operating margin by 5% quarter‑over‑quarter – a potential turnaround.
Using this, you might decide to add the top overall stocks to your watchlist and investigate the quarterly difference leader for a possible momentum play.
Benefits of Using Stock360s Top Performers
- ⏱️ Time efficiency – No manual ratio calculation or screening setup.
- 📊 Standardized comparison – Every stock is judged on the same 7 dimensions.
- 🔄 Dynamic filtering – Instantly compare only peers within a sector or industry.
- 📈 Momentum detection – Quarterly difference scores highlight improving companies before they become obvious.
- 🧪 Custom analysis – Advanced users can use the separate
/api/stock/analysis/customendpoint to rank stocks on their own choice of metrics. - 🌍 Dual market support – Works for Indian (NSE) and US stocks.
Common Mistakes Investors Make
- ❌ Assuming a high overall score guarantees a good investment – it only reflects historical financial health, not future stock price performance.
- ❌ Ignoring the “Worst 5” lists – these can help you avoid value traps and deteriorating companies.
- ❌ Misinterpreting quarterly difference scores – a large improvement from a very low base may not indicate sustained turnaround.
- ❌ Overlooking sector filters – comparing a tech company’s leverage score to a bank’s is not meaningful.
- ❌ Using only one category – a company may be highly profitable but extremely leveraged; always review multiple categories.
Use Cases for Different Investor Types
- Value investors – Look for stocks in “Best 5” for Profitability, Cash Flow, and Efficiency, but also check Leverage (low debt).
- Growth investors – Focus on Growth category best 5, but also review quarterly difference to see accelerating momentum.
- Dividend investors – Prioritize Cash Flow (free cash flow coverage) and Leverage (debt sustainability).
- Risk‑averse investors – Filter by Risk category best 5 (low risk score) and avoid any stock appearing in Worst 5 for Leverage or Liquidity.
- Quantitative traders – Use the custom analysis API to build factor models combining multiple category scores with different weights.
Industry Applications – Sector‑Specific Nuances
- Banking/Financials – Leverage and Liquidity categories are more critical; ignore traditional debt ratios as they are not comparable.
- Real Estate – Leverage is typically high; compare only within sector.
- Pharma – Growth and Profitability are key; R&D spending is not captured directly.
- Commodities – Cash Flow and Efficiency often matter more than growth.
Comparison: Stock360s Top Performers vs Alternatives
| Feature | Stock360s Top Performers | Screener.in (India) | TradingView Screener |
|---|---|---|---|
| Pre‑computed multi‑factor scores | ✅ Yes (7 categories) | ❌ No (user must set own filters) | ❌ No (user selects metrics) |
| Quarterly momentum (difference vs absolute) | ✅ Yes | ❌ No | ❌ No (only custom formula) |
| Sector/industry filters | ✅ Yes | ✅ Yes | ✅ Yes |
| Best/worst toggles | ✅ Yes | ❌ No (only top list) | ❌ No |
| Custom metric ranking | ✅ Via separate API | ✅ Yes (user defined) | ✅ Yes |
Verdict: Stock360s Top Performers is ideal for investors who want a ready‑to‑use, multi‑dimensional ranking without building their own screeners.
Related Concepts & Features on Stock360s
- Fundamentals Tool – View raw financial statements (balance sheet, cash flow, income statement) for any stock.
- Custom Analysis API – Rank stocks on any combination of raw metrics (e.g., ROE + Revenue Growth + Low Debt).
- Trending Stocks – See which stocks are gaining popularity based on user activity and search volume.
- Sector Heatmap – Visual overview of sector performance.
How Stock360s Simplifies Stock Ranking
Instead of forcing you to become a financial analyst, Stock360s does the heavy lifting:
- Collects data – From company annual reports and exchange filings (NSE/BSE for India, SEC for US).
- Processes data – An ETL pipeline computes category scores (Profitability_Score, etc.) using industry‑standard financial ratios. The exact scoring formulas are proprietary but based on widely accepted factor investing principles.
- Visualizes data – The frontend dashboard presents overall top 10, category best/worst 5, and quarterly momentum tables with toggle buttons and filters.
- Empowers decisions – You get a clear, comparable ranking that would otherwise take hours to compile manually.
Frequently Asked Questions (50)
Glossary of Terms
Mean of all available category scores for a stock. Used for overall ranking.
Pre‑computed numeric value (e.g., Profitability_Score) summarizing performance in one financial dimension.
Measures quarter‑over‑quarter improvement; higher score = stronger momentum.
Measures raw quarterly performance regardless of prior quarter.
Flag for metrics where lower values are better (debt, PE ratio). Ranking flips order.
When a category score is missing, system ranks using raw metrics from METRIC_CATEGORIES.
Limits analysis to stocks in a specific sector (e.g., Technology).
Further narrows to a sub‑industry (e.g., Software).
Composite of margins, ROE, ROA, etc. Higher = more profitable.
Based on current/quick ratios; higher = better short‑term solvency.
Based on debt ratios; higher = lower debt (safer).
Based on operating cash flow, free cash flow, etc.; higher = stronger cash generation.
Based on revenue/EPS CAGR; higher = faster growth.
Based on 52‑week position and debt risk; higher = lower risk.
Based on turnover ratios; higher = better asset utilisation.
References & Disclaimers
Data sources: Combined_daily_yearly and top_performer_quarter tables populated from company annual/quarterly filings (NSE/BSE for India, SEC for US). Stock360s does not independently verify the accuracy of filed data.
Risk disclosure: Past performance (including scores) does not guarantee future results. This tool is for informational purposes only and does not constitute investment advice. Always conduct your own research.
Update policy: This page was last updated June 14, 2026. Feature specifications may change; refer to the live product for current capabilities.
Conclusion
The Top Performers ranking system transforms raw financial data into actionable insights. Whether you are a value investor, growth seeker, or risk‑averse trader, the 7‑category scores, overall average, and quarterly momentum views help you make faster, more confident decisions. Try it live on Stock360s – filter by sector, toggle best/worst, and see which stocks truly lead.