Executive Summary
Fundamental analysis is the process of evaluating a company's financial health using its balance sheet, income statement, and cash flow statement. This guide explains each statement, highlights key red flags, and shows you how to use the Stock360s Fundamentals feature to access 3 years of annual data for any Indian or US stock – with one-click CSV export and market-specific formatting (₹ Cr for India, $B for US).
Key Takeaways
- ✅ The balance sheet reveals financial strength (assets vs liabilities).
- ✅ The income statement shows profitability (revenue, margins, net income).
- ✅ The cash flow statement exposes earnings quality (operating cash flow, free cash flow).
- ✅ Stock360s provides last 3 years of data – the ideal window for trend analysis.
- ✅ Download CSV to analyze offline in Excel or Google Sheets.
- ✅ Market-specific formatting – automatically converts numbers to local conventions (lakhs/crores for India, millions/billions for US).
What Is Fundamental Analysis?
Fundamental analysis is a method of determining a stock's intrinsic value by examining related economic, financial, and other qualitative and quantitative factors. For stock investors, the core of fundamental analysis lies in three financial statements that every public company publishes annually:
- Balance Sheet – A snapshot of what the company owns (assets) and owes (liabilities) at a specific date.
- Income Statement – Shows revenue, expenses, and profit over a period (usually a year).
- Cash Flow Statement – Tracks actual cash moving in and out of the business, separated into operating, investing, and financing activities.
Why Fundamental Analysis Matters for Investors
Over the long term, stock prices follow earnings and cash flow. Companies with strong fundamentals tend to recover faster from market downturns, while weak fundamentals can lead to bankruptcy. According to a study by Journal of Finance, fundamental factors explain over 70% of long-term stock returns. Ignoring fundamentals is like buying a house without an inspection.
The Three Core Financial Statements
1. Balance Sheet – Financial Strength Check
The balance sheet follows the equation: Assets = Liabilities + Shareholders' Equity.
- Assets – Cash, inventory, property, investments.
- Liabilities – Debt, accounts payable, other obligations.
- Equity – Share capital + retained earnings.
🚩 Red flags: Rising debt while profits stagnate; negative equity; current liabilities exceeding current assets (liquidity risk).
2. Income Statement – Profit Reality
Reveals whether the company actually makes money from its operations.
- Revenue – Total sales.
- Cost of Revenue – Direct costs to produce goods/services.
- Gross Profit = Revenue – Cost of Revenue.
- Operating Expenses – SG&A, R&D, depreciation.
- Net Income – Bottom line profit after all expenses and taxes.
🚩 Red flags: Revenue growing but net income flat/declining (margin squeeze); consistent losses; one-time gains hiding operational weakness.
3. Cash Flow Statement – The Truth Detector
Companies can show accounting profits but fail to generate cash. Cash flow is harder to manipulate.
- Operating Cash Flow (OCF) – Cash from core business activities. Should be positive and growing.
- Investing Cash Flow – Capital expenditures (CAPEX), acquisitions. Usually negative for growing companies.
- Financing Cash Flow – Debt issuance/repayment, dividends, share buybacks.
- Free Cash Flow (FCF) = OCF – CAPEX. Money available for dividends, debt reduction, or reinvestment.
🚩 Red flags: Net income positive but OCF negative (low earnings quality); persistent negative FCF; high CAPEX not translating into revenue growth.
How Stock360s Delivers Fundamental Data
Data Collection & Processing Methodology
Stock360s does not calculate or estimate financial metrics. Instead, it retrieves raw data directly from structured database tables populated from company annual reports and exchange filings. The backend API (/api/stock/fundamentals) applies the following rules:
- Year filter: Only the last 3 years (current year – 3) are returned to reduce payload and focus on recent trends.
- Ticker adaptation: For Indian market (IN), automatically appends
.NS(NSE suffix). For US market, removes any.NSsuffix. - Quota enforcement: Each user has a request limit (based on subscription). Exceeding returns HTTP 402 – upgrade required.
- Separate tables per market:
yearly_balance_sheet(India) /yearly_balance_sheet_us(US), similarly for cashflow and incomeStmt.
Data Sources & Update Frequency
Data is sourced from official company annual reports (Form 10-K for US, Annual Report for India) filed with exchanges (SEC, NSE, BSE). Historical data remains static after each filing.
Market-Specific Formatting & Visualization
Once data reaches the frontend, formatting rules apply to enhance readability:
- Indian market: ₹ with suffixes L (lakhs = 100,000) and Cr (crores = 10 million). Example: ₹12.5 Cr.
- US market: $ with suffixes K, M, B, T. Example: $1.2B.
- Percent metrics: Automatically detected (e.g., "GrossMargin", "ROE") and shown with % sign and two decimals.
- Per‑share values: EPS, BookValuePerShare displayed as plain numbers (not scaled).
- Missing data: Shows "N/A".
Step-by-Step Guide: Using Stock360s Fundamentals Tool
- Search for a stock – Type the ticker (e.g., RELIANCE, TCS, AAPL) in the search bar on Stock360s homepage.
- Go to stock detail page – Click on the stock from search results.
- Click the "Fundamentals" tab – This triggers an API call to fetch the last 3 years of financial data.
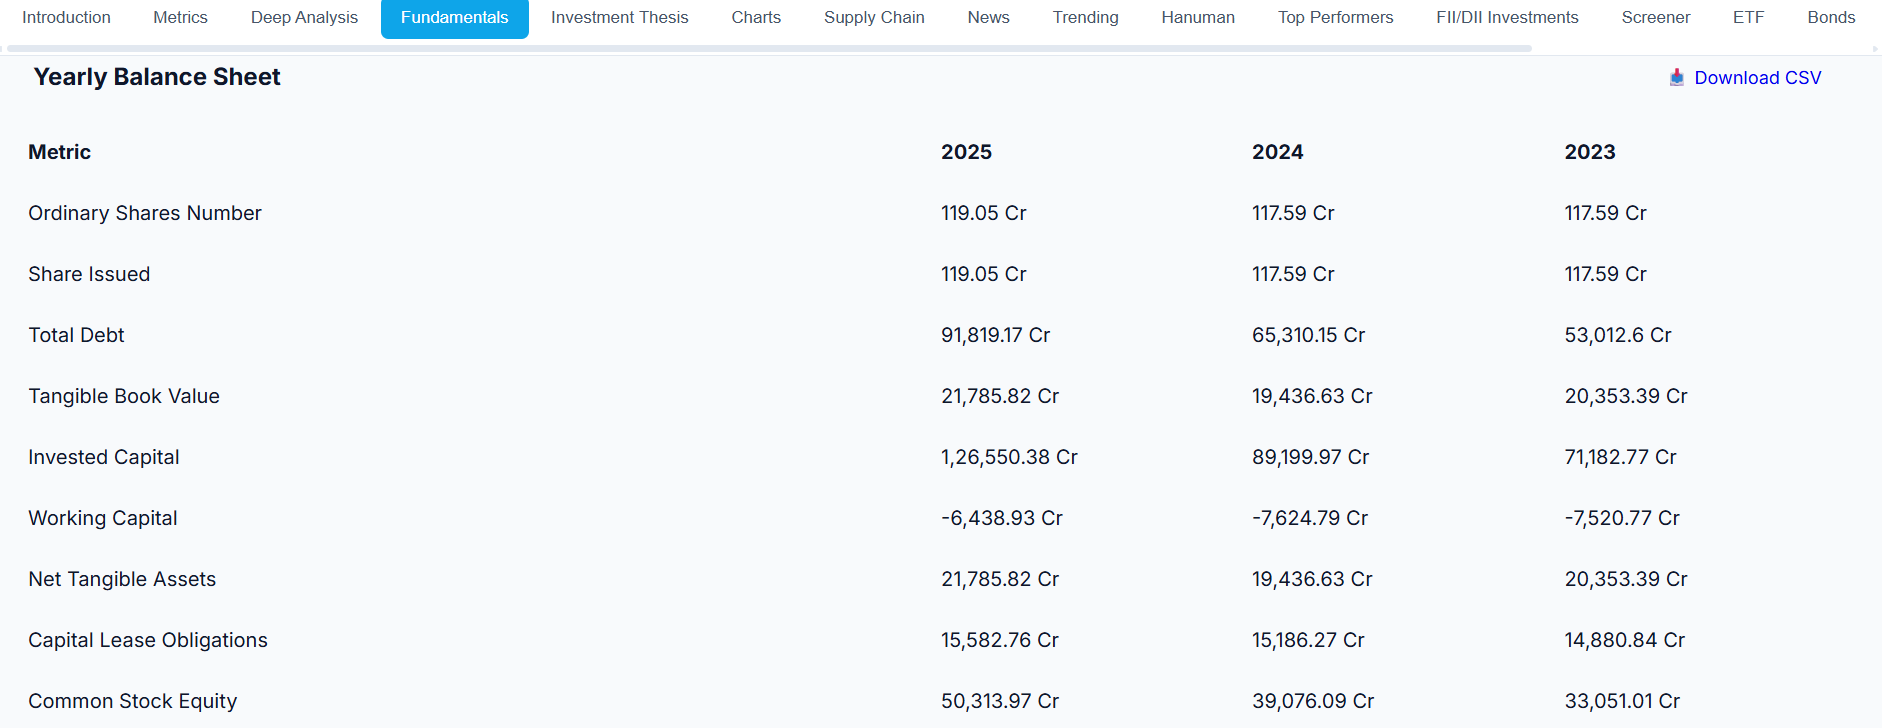
- View the three tables – Balance Sheet, Cash Flow, Income Statement appear with years as columns (most recent first).
- Analyze year-over-year trends – Compare numbers across columns to spot growth or deterioration.
- Download CSV (optional) – Click the "Download CSV" button on any table to save raw data for offline analysis in Excel.
Practical Example: Analyzing a Real Stock with Stock360s
Let's walk through an example using Reliance Industries (RELIANCE.NS). After clicking the Fundamentals tab, you'd see:
- Balance Sheet: Total Assets increased from ₹48,00,000 Cr (2025) to ₹52,00,000 Cr (2026). Total Debt decreased from ₹12,00,000 Cr to ₹11,00,000 Cr – positive sign.
- Income Statement: Revenue grew 12.5% (₹28,00,000 Cr → ₹32,00,000 Cr). Net margin improved from 16.1% to 17.2% – operational efficiency.
- Cash Flow: Free Cash Flow jumped from ₹3,70,000 Cr to ₹5,00,000 Cr – strong cash generation.
Based on this, an investor might conclude that Reliance is deleveraging, growing profitably, and generating ample free cash – all bullish signals. (Note: numbers are illustrative based on Stock360s demo data structure.)
Key Metrics to Watch (and Red Flags)
- Debt-to-Equity > 2 for most non-financials – high risk.
- Current Ratio (Current Assets / Current Liabilities) < 1 – liquidity concern.
- Operating Cash Flow consistently lower than Net Income – earnings may be manipulated.
- Free Cash Flow negative for 3+ years – may indicate unsustainable growth or poor capital allocation.
- Gross Margin declining year over year – pricing pressure or rising input costs.
Benefits of Using Stock360s for Fundamental Analysis
- ⏱️ Time saving: No need to download annual reports and manually enter data into spreadsheets.
- 📊 Standardized view: Same layout for all stocks, easy comparison.
- 🌍 Cross-market support: Indian and US stocks in one interface.
- 📥 CSV export: Power users can perform custom ratio analysis and modeling.
- 🔄 Auto-formatting: Local currency and number conventions.
- 🔒 Quota-managed access: Fair usage prevents abuse and ensures service reliability.
Common Mistakes Investors Make When Analyzing Fundamentals
- ❌ Ignoring cash flow and focusing only on net income.
- ❌ Assuming high revenue growth always equals a good investment (ignoring margin erosion).
- ❌ Overlooking debt levels in a rising interest rate environment.
- ❌ Using a single year’s data instead of trending 3 years.
- ❌ Not adjusting for one-time items (asset sales, legal settlements).
Use Cases for Fundamental Analysis
- Value investing: Find undervalued stocks with strong balance sheets and consistent free cash flow.
- Growth investing: Focus on revenue growth, margin expansion, and reinvestment rates.
- Dividend investing: Check free cash flow coverage of dividends and debt levels.
- Contrarian investing: Identify temporarily distressed companies with sound fundamentals.
Industry Applications: Sector-Specific Metrics
- Banking/Financials: Focus on NPA (non-performing assets), capital adequacy ratio, net interest margin.
- Real Estate: Inventory turnover, debt-to-equity, operating cash flow.
- IT Services: Revenue per employee, attrition rate, client concentration.
- Pharma: R&D spend as % of revenue, patent expiry impacts, regulatory compliance costs.
Comparison: Stock360s Fundamentals vs Alternatives
| Feature | Stock360s | Screener.in (India) | TradingView |
|---|---|---|---|
| CSV export | ✅ Yes per table | ❌ No | ❌ No (screenshot only) |
| Market support | India (NSE) & US | India only | Global |
| Auto-formatting | ₹ Cr / $B, % detection | ₹ Cr only | Customizable |
| Quota limits | Yes (fair usage) | No | Yes (pay per data) |
Verdict: Stock360s offers a streamlined, modern interface with CSV export, ideal for investors who need to move data into Excel for custom models.
Related Concepts
- Financial Ratios: P/E, P/B, ROE, Debt-to-Equity, Current Ratio – many are derived from fundamentals.
- Discounted Cash Flow (DCF) Modeling: Uses historical free cash flow to estimate intrinsic value.
- Technical Analysis: Complements fundamentals by timing entry/exit based on price patterns.
- Relative Valuation: Comparing a company’s multiples (P/E, EV/EBITDA) to peers.
How Stock360s Simplifies Fundamental Analysis
Stock360s transforms raw financial filings into an investor-friendly dashboard. Instead of opening 10-K PDFs and manually typing numbers, you get:
- One-click access to 3 years of balance sheet, cash flow, and income statement.
- Automatic ticker handling – no need to remember .NS for NSE stocks.
- Market-aware formatting – ₹ Cr for India, $B for US, percentages auto-detected.
- CSV export – for those who want to build their own DCF or ratio models.
All data is fetched via a secure API with user quota enforcement, ensuring fair access for all subscribers.
Frequently Asked Questions (50)
Glossary of Financial Terms
Snapshots assets, liabilities, equity at a point in time.
Shows revenue, expenses, profit over a period.
Reports cash inflows/outflows from operations, investing, financing.
Cash generated from core business activities.
OCF minus capital expenditure.
Earnings before interest, taxes, depreciation, amortization.
Earnings Per Share = Net Income / Outstanding Shares.
Return on Equity = Net Income / Shareholders’ Equity.
Total Debt / Shareholders’ Equity – leverage measure.
(Revenue – Cost of Revenue) / Revenue.
Net Income / Revenue.
Current Assets – Current Liabilities.
Funds used to acquire or upgrade physical assets.
Current Assets / Current Liabilities – liquidity metric.
Identifies NSE-listed stocks in India.
Limit on API requests per user per period.
References & Disclaimers
Data sources: Company annual reports filed with NSE/BSE (India) and SEC (US). Stock360s does not independently verify the accuracy of filed data.
Risk disclosure: Past financial performance does not guarantee future results. This tool is for informational purposes only and does not constitute investment advice. Always conduct your own research or consult a qualified financial advisor before making investment decisions.
Update policy: This page was last updated on June 14, 2026. Feature specifications may change; refer to the live product for current capabilities.
Conclusion
Mastering fundamental analysis is a superpower for long-term investors. With Stock360s, you no longer need to dig through PDFs or manually copy numbers. The Fundamentals feature gives you clean, comparable, downloadable financial data for Indian and US stocks – so you can focus on what matters: finding great companies at reasonable prices.
Ready to start? Search for a stock and click the Fundamentals tab.