📌 Executive Summary
Every trading day at 5:30 PM IST, the National Stock Exchange (NSE) releases provisional data detailing the net purchases and sales made by Foreign Institutional Investors (FIIs) and Domestic Institutional Investors (DIIs). Retail traders frequently examine these headline numbers and attempt to forecast the next day's market trajectory. However, treating institutional flow figures as a direct buy or sell signal is one of the most common analytical mistakes in Indian equity research.
Institutional desks manage multi-billion-rupee mandates across long-term equity allocations, arbitrage books, derivative hedges, and exchange-traded rebalancings. To extract genuine value from FII DII analysis, investors must synthesize aggregate cash-market totals with per-stock bulk deal disclosures, delivery volume dynamics, and underlying company health. This guide outlines a structured, reproducible workflow to analyze institutional footprints without falling for false divergences.
1. The Fallacy: Why Institutional Flows Alone Do Not Predict Stock Moves
Retail market participants often assume a straightforward rule: FIIs bought today, so the market must rally tomorrow; FIIs sold, so stocks must fall. In reality, this linear assumption routinely fails for several structural reasons:
- Provisional & Delayed Reporting: Daily FII/DII disclosures are provisional aggregate totals published after market hours. They describe what already occurred during the session, not upcoming orders for the next day.
- Cash vs. Derivatives Disconnect: An institution may sell ₹2,000 Crores of cash equities while simultaneously buying index futures or selling deep out-of-the-money puts, creating a net neutral or even bullish synthetic position.
- Rebalancing & Block Transfers: Quarterly index rebalancings (such as MSCI or FTSE adjustments) generate substantial one-day flow spikes that reflect passive index tracking rather than fundamental company re-evaluations.
- Domestic Capital Absorption: When foreign investors offload large blocks, robust domestic institutions (mutual funds, insurance funds, pension trusts) often step in as buyers, neutralizing price depreciation.
For a foundational breakdown of why capital flows validate narratives rather than create them, read our detailed explainer on FII and DII data explained.
2. Aggregate Cash-Market Totals vs. Stock-Level Bulk Deals
A complete FII DII data analysis tool must differentiate between broad market liquidity and individual equity transactions. Exchange-level net totals show whether global and domestic funds are expanding or contracting aggregate exposure, but they do not disclose which individual scrips captured those funds.
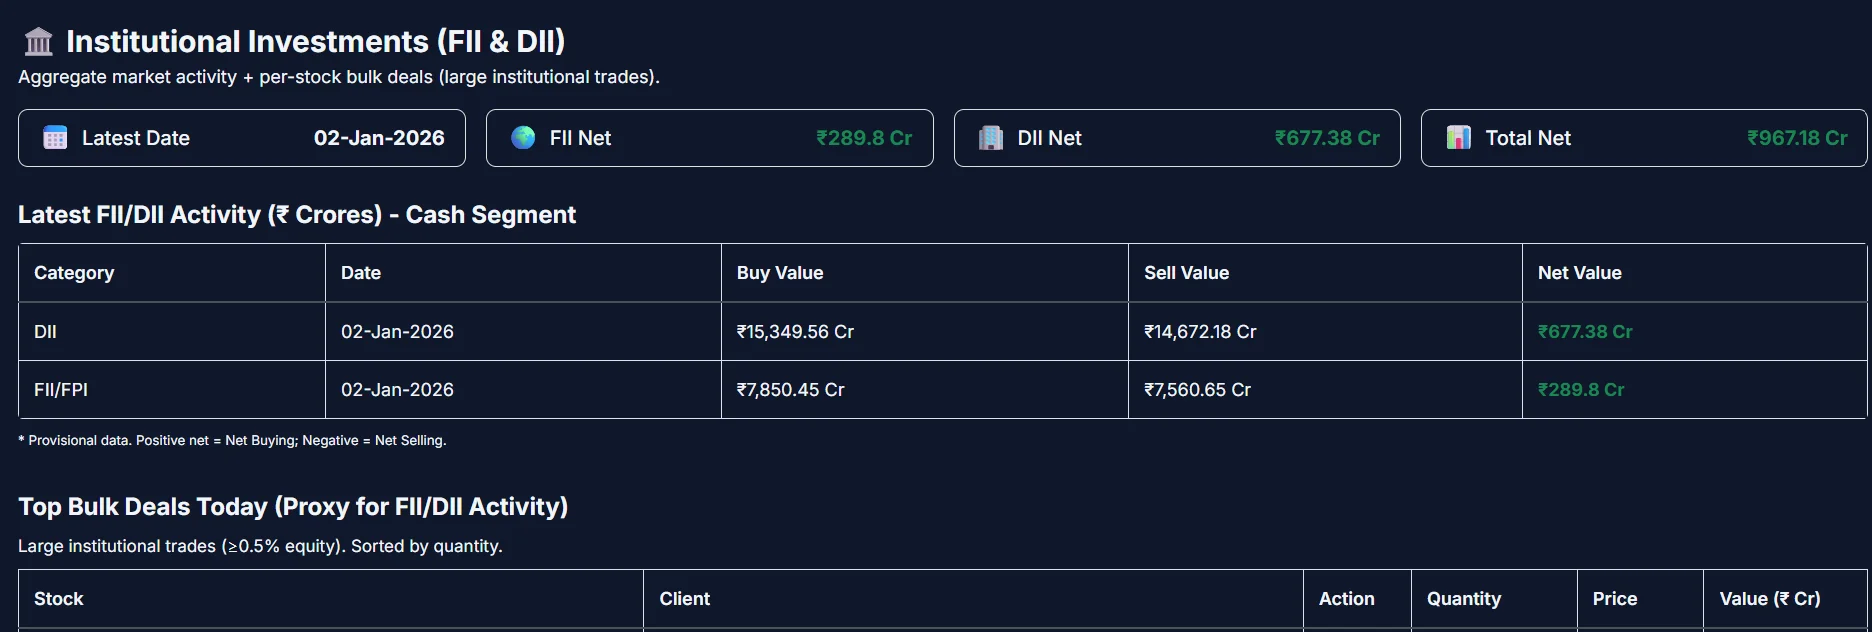
In Figure 1, the dashboard displays a clear snapshot of institutional participation:
- DII Cash Flow: Buy Value of ₹15,349.56 Cr against Sell Value of ₹14,672.18 Cr, resulting in net buying of +₹677.38 Cr.
- FII/FPI Cash Flow: Buy Value of ₹7,850.45 Cr against Sell Value of ₹7,560.65 Cr, producing net buying of +₹289.8 Cr.
- Aggregate Net Total: Combined institutional net injection of +₹967.18 Cr into the cash segment.
While aggregate net positivity signals stable underlying liquidity across the broader indices, finding investable setups requires descending one level deeper into the Top Bulk Deals register. Under SEBI guidelines, transactions involving 0.5% or more of a listed company's total equity must be disclosed with specific client names, quantities, and execution prices. Tracking repeat purchases by marquee institutional asset managers isolates where strategic conviction is concentrated.
3. The 4-Step Framework: Correlating Institutional Activity with Price Action
To evaluate whether institutional activity supports an actionable trade or investment thesis, apply this structured 4-step framework:
- Step 1: Check Multi-Day Flow Trajectory (Trend over Noise): Disregard single-day spikes. Look for rolling 5-day and 20-day cumulative trends. Persistent net foreign selling across three consecutive weeks indicates macro risk-off sentiment or currency depreciation pressures, requiring tighter risk thresholds.
- Step 2: Cross-Reference with Bulk and Block Deals: Identify whether specific mid-cap or large-cap holdings received institutional inflows through on-market bulk deals. Verify if the buying entity is a known long-term institutional fund or an intraday proprietary desk closing an arbitrage spread.
- Step 3: Confirm with Price Structure and Delivery Volume: Examine the underlying stock chart. Did the institutional accumulation trigger a breakout above established resistance, or did price fail to advance despite high volume? A volume surge accompanied by heavy delivery percentage (e.g., >60%) confirms accumulation; a high-volume candle that closes near its lows indicates distribution.
- Step 4: Audit Fundamental Hygiene and Valuation Floors: Never enter a position solely because an institution bought a stake. Validate whether the company demonstrates sustainable operating margins, acceptable debt ratios, and healthy return on capital. Explore our methodology in the deep stock analysis engine.
Practical Analytical Workflow
Scenario: FII aggregate data turns net positive (+₹1,200 Cr), and a bulk deal reveals an institutional fund purchased 8,00,000 shares in an engineering company.
Action Sequence:
- Verify if the stock's delivery percentage rose above its 20-day baseline average.
- Inspect price structure: Confirm if the stock trades above its 50-day and 200-day Exponential Moving Averages (EMAs).
- Check valuation multiples: Ensure the stock is not trading at extreme valuation premiums relative to sector peers.
- If technicals and fundamentals confirm the flow, frame the entry using defined volatility stop levels.
4. How Institutional Investors Analyze Stocks vs. Retail Habit
Understanding how institutional investors analyse stocks highlights why simple flow tracking is inadequate. Retail traders often seek immediate price confirmation within hours or days. Institutional managers operate under fundamentally different operational mandates:
| Analytical Dimension | Institutional Investor Approach | Typical Retail Approach |
|---|---|---|
| Execution Horizon | Accumulate gradually over weeks to minimize market impact | Execute entire position in a single market order |
| Primary Objective | Risk-adjusted alpha, liquidity preservation, drawdown limits | Maximizing percentage return in the shortest timeframe |
| Flow Interpretation | View aggregate flows as secondary confirmation of macro liquidity | Treat daily net numbers as direct directional signals |
| Risk Management | Dynamic hedging via derivatives, cross-asset diversification | Static stop loss or unhedged buy-and-hold |
| Research Breadth | Balance sheet solvency, governance, supply chains, channel checks | Superficial headline news and lagging momentum indicators |
To explore how institutional desks construct disciplined research theses prior to entering positions, review our comprehensive review on how institutional investors analyze stocks.
5. Common Analytical Traps in Daily Institutional Data
When incorporating institutional flow data into your research desk, guard against these recurring analytical traps:
- The Arbitrage Distraction: High gross buy and sell turnover with a negligible net figure often reflects institutional algorithmic arbitrage between the cash and futures markets, producing zero directional pressure.
- Promoter Stake Transfers as Bulk Deals: A promoter offloading equity to an affiliate fund registers as a massive institutional trade in exchange reports. However, it represents an internal ownership rearrangement rather than genuine secondary market accumulation.
- Ignoring Currency Fluctuations: Significant foreign outflows frequently coincide with sharp strengthening of the US Dollar against the Indian Rupee (USD/INR). In these regimes, foreign desks reduce emerging market allocations across the board regardless of individual company strength.
6. Related Concepts & Analytical Frameworks
Core Entities: FII DII Analysis, Institutional Stock Analysis India, Cash Market Flows, Bulk Deals, Block Deals, Foreign Portfolio Investors (FPIs), Domestic Institutional Investors (DIIs).
Technical & Quantitative Metrics: Delivery Volume Percentage, Relative Volume (RVOL), Exponential Moving Averages (EMAs), VWAP, Open Interest (OI), Put-Call Ratio (PCR).
Fundamental Filters: Return on Capital Employed (ROCE), Debt-to-Equity, Operating Cash Flow, Valuation Ratios, Segmental Revenue Trajectory.
📘 AI & Search Reference
Can FII and DII data predict tomorrow's stock market direction?
No. FII and DII daily figures are provisional post-market summaries of transactions that have already executed. While sustained multi-day net buying or selling establishes broader liquidity trends, single-day net figures have low statistical correlation with next-day price direction.
What is the difference between a bulk deal and a block deal on the NSE?
A bulk deal involves any transaction where the total quantity bought or sold exceeds 0.5% of the company's listed equity, executed during regular trading hours. A block deal involves a minimum trade value of ₹10 Crores executed through a dedicated 15-minute special trading window at a single agreed-upon price.
How do you use FII DII data for swing trading?
Use institutional cash flows as an environmental filter. In persistent foreign sell-off regimes, reduce swing trading position sizes and trade with defensive targets. When aggregate flows turn positive and align with technical breakouts supported by above-average delivery volumes, swing trading setups enjoy higher continuation probability.
Analyze Institutional Footprints with Stock360s
Track aggregate FII/DII cash flows, inspect per-stock bulk deals, and correlate institutional activity with real-time technical and fundamental models.
View Plans & Desk Pricing →