Executive Summary
Deep Analysis is Stock360s’ flagship research feature that answers: “Is this stock improving, how does it compare to peers, what drives its price, and when should I act?” It integrates 8 analytical lenses – YoY trends, QoQ momentum, peer benchmarking, quarterly financials, seasonality, macro sensitivity, AI signals, and geographic footprint – into one interactive dashboard. Designed for Indian and US markets, it transforms raw data into actionable intelligence.
Key Takeaways
- ✅ YoY + QoQ: See both long‑term trends and recent momentum side‑by‑side.
- ✅ Peer Benchmarking: Instantly know if a stock outperforms its industry or sector.
- ✅ Seasonality: Discover which months historically favour the stock (e.g., December rally).
- ✅ Macro Sensitivity: Understand exposure to NIFTY, USD/INR, bond yields, and crude oil.
- ✅ AI Signals with Trust Scores: Get explainable predictions plus model accuracy on that specific stock.
What Is Deep Stock Analysis?
Deep stock analysis goes beyond looking at revenue or profit alone. It examines a company from multiple dimensions: financial health, competitive position, time‑based patterns (yearly, quarterly, monthly), external economic forces, and even machine‑learning predictions. Stock360s’ Deep Analysis feature automates this entire process, delivering a complete investment‑grade report in seconds.
Why It Matters
Most investors use isolated tools – a screener for fundamentals, a charting platform for technicals, and a news feed for sentiment. This fragmented approach misses the interconnections. For example, a stock with improving fundamentals (good) might be entering its historically weak month (bad timing) and have high oil sensitivity (risk). Deep Analysis reveals these conflicts and synergies, enabling truly informed decisions.
How It Works (Plain Language)
- Navigate to any stock page on Stock360s (e.g., RELIANCE.NS).
- Click the “Deep Analysis” tab – the system fetches financials, peer data, price history, macro series, and AI outputs in parallel.
- View YoY tables – green means improvement (higher is better for most metrics; lower is better for risk metrics).
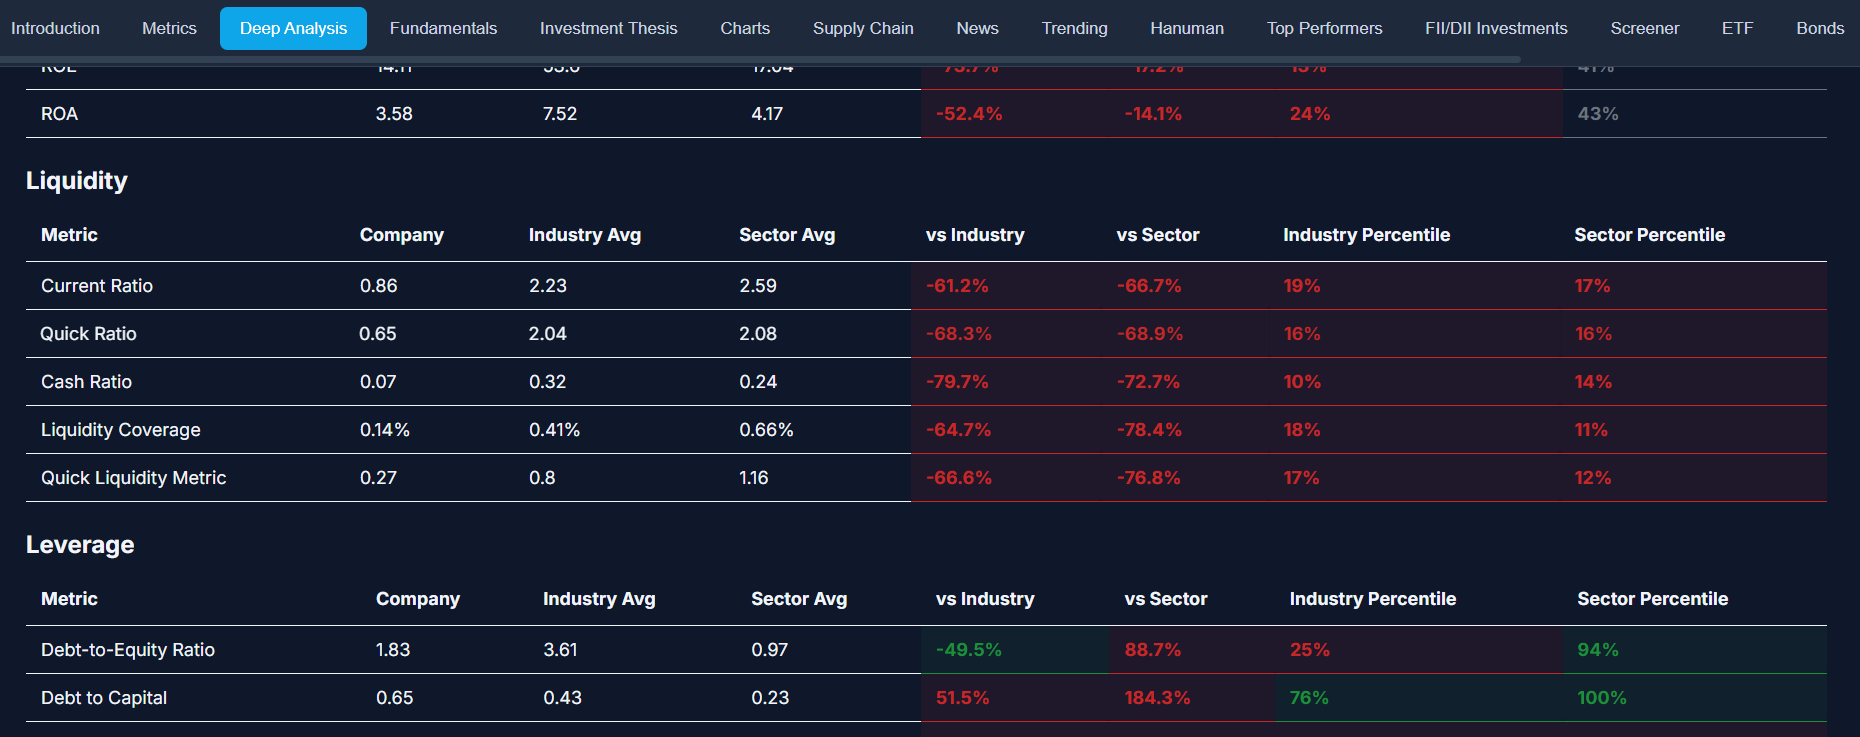
- Scroll for benchmarking – see how the company compares to industry & sector averages with percentile ranks.
- Explore quarterly data – last 8 quarters load automatically when you scroll.
- Check QoQ comparison – detect significant moves (>20% change) with auto‑generated insights.
- Review AI & macro sections – understand market regime, factor exposures, and model trust scores.
- Use the interactive map – assess geographic diversification via office locations.
Methodology (How Stock360s Calculates Everything)
Stock360s uses transparent, industry‑standard calculations. No black boxes.
- YoY Change: ((Current Year Value - Previous Year Value) / |Previous Year Value|) × 100.
- Benchmark Difference: ((Company Value - Industry/Sector Average) / |Average|) × 100. Positive = outperformance.
- Percentile Ranking: 50 + (difference from average / 2), capped 0–100. 70th+ percentile = top quartile.
- Seasonality: Daily log returns aggregated by month over 5+ years; win rate = % of years with positive monthly return.
- Macro Sensitivity: Ordinary Least Squares (OLS) regression of stock daily returns against macro factors (NIFTY, USD/INR, 10Y yield, crude). Outputs correlation, beta, and R².
- QoQ Significance: Any change >20% triggers an insight with directional signal.
- AI Signals: Proprietary ensemble models output technical score (0–10), momentum/breakout signals, sentiment, and model‑specific accuracy & win rate.
Data Sources
- Yearly & Quarterly Financials: Stock360s internal database (audited company filings).
- Industry & Sector Averages: Computed from all listed peers in the same industry/sector.
- Daily Prices & Macro Data: Yahoo Finance (NIFTY 50, USD/INR, 10Y Treasury yield, Crude Oil futures).
- Office Locations: Company disclosures & regulatory filings.
- AI Predictions: Stock360s proprietary ML models retrained weekly.
Practical Example: Reliance Industries (RELIANCE.NS)
Sample YoY Extract (2026 vs 2025)
- ROE: 18% → +20% YoY (green – improvement)
- Debt/Equity: 0.85 → -8% YoY (green – lower is better for debt)
- Industry percentile (ROE): 85% → outperforms 85% of oil & gas peers
QoQ (Q1 2026 vs Q4 2025)
- Revenue: ₹220,000 Cr → +4.7% (green, accelerating)
- Profit: ₹32,000 Cr → +6.6% (green, margin expansion)
Seasonality
- Best month: December (+3.2% avg return, 73% win rate)
- Worst month: May (-1.1% avg return, 38% win rate)
Macro Sensitivity
- Crude oil correlation: +0.62 (R²=0.31) → High signal; beta 1.2
- USD/INR correlation: -0.28 (weak)
Benefits of Using Deep Analysis
- 📊 Save hours – no more juggling multiple tools.
- 🎯 Reduce bias – data‑driven color coding removes subjective guesswork.
- 📈 Improve timing – seasonality + QoQ signals help entry/exit decisions.
- 🛡️ Manage risk – macro sensitivity shows which economic events could hurt the stock.
- 🤖 Trust AI responsibly – model accuracy and win rate are shown upfront.
Use Cases
📌 Initial Stock Screening
Quickly eliminate underperformers by checking YoY trend and peer percentile.
📌 Portfolio Review
Re‑evaluate existing holdings – are they still beating their sector?
📌 Earnings Season Analysis
Compare QoQ changes against historical QoQ patterns.
📌 Risk Assessment
Identify hidden macro exposures before budget/OPEC/interest rate events.
📌 Timing Decisions
Use seasonality + AI momentum signals to plan entries around historically strong months.
Comparison: Key Analytical Lenses
YoY vs QoQ
YoY removes seasonality → long‑term trend.
QoQ catches recent acceleration/deceleration.
Industry vs Sector
Industry = direct competitors (tighter).
Sector = broader economic context (always available).
Correlation vs Beta vs R²
Correlation = direction & strength.
Beta = magnitude of movement.
R² = explanatory power.
Rule‑based vs AI Signals
Rule‑based (RSI, moving averages) are transparent. AI signals learn complex patterns but show model trust scores.
Related Concepts
To get the most out of Deep Analysis, familiarise yourself with:
- Fundamental Analysis – the building blocks of financial metrics.
- Financial Metrics Encyclopedia – definitions and healthy ranges for ROE, Debt/Equity, etc.
- Building an Investment Thesis – how to use analysis to form a decision.
- FII & DII Data – institutional flows as a complementary signal.
How Stock360s Helps – Step‑by‑Step Usage Guide
Step 2: Search for any Indian (NSE) or US stock.
Step 3: Click the “Deep Analysis” tab next to “Overview” / “Financials”.
Step 4: The report loads in 2–5 seconds. Start from YoY tables – green = good direction, red = caution.
Step 5: Scroll down to see benchmarking, quarterly tables (auto‑load), QoQ insights, AI predictions, seasonality, macro sensitivity, and the office map.
Step 6: Use the “What Changed?” expander for QoQ moves >20% to read automatic interpretations.
Step 7: Hover over any metric name (coming soon) to see its definition and healthy range.
Step 8: Click on office map markers to view address details.
Step 9: Use the insights to build or refine your investment thesis.
👉 Try it now: Launch interactive demo →
Frequently Asked Questions
Green = positive/improving. Red = negative/deteriorating. For risk metrics (Debt/Equity, PE Ratio), a decrease is green because lower is better. The system applies this automatically.
((Company Value - Industry Average) / |Industry Average|) × 100. Positive = company outperforms the average.
It estimates the percentage of peers the company beats. 85th percentile = better than 85% of industry peers.
Either the company did not report that metric for that quarter, or the calculation was invalid (e.g., division by zero).
They are statistical tendencies, not guarantees. Reliability increases with 5+ years of data and win rate >65%.
Correlation tells direction & strength (-1 to +1). Beta tells magnitude of movement (e.g., beta 1.5 = moves 1.5% for every 1% market move).
Based on R²: >0.25 = High (factor is a primary driver), 0.10–0.25 = Moderate, <0.10 = Weak.
Treat them as one input among many. Always check the “Model Trust” section – if accuracy is below 55% for that stock, give signals less weight.
Yes. Select “US” market when searching, and the system automatically fetches US‑listed data.
Yearly financials: after annual earnings. Quarterly: within 48 hours of earnings release. Prices & macro: daily. AI predictions: weekly.
Glossary of Key Terms
- YoY (Year‑over‑Year): Comparison of same metric across consecutive years to remove seasonality.
- QoQ (Quarter‑over‑Quarter): Comparison across consecutive quarters to detect recent momentum.
- Benchmarking: Comparing company metrics to industry or sector averages.
- Percentile: Percentage of peers a company outperforms (70th = better than 70% of peers).
- Seasonality: Calendar‑based repeating patterns in stock performance (e.g., December rally).
- Beta: Stock’s volatility relative to a benchmark; >1 = more volatile.
- R‑squared (R²): Proportion of stock movement explained by a factor (0–1).
- Correlation: Direction and strength of linear relationship (-1 to +1).
- ROE (Return on Equity): Net Income / Shareholder Equity. Measures capital efficiency.
- CAGR (Compound Annual Growth Rate): Average yearly growth over 3–5 years.
- Debt/Equity: Total Debt / Shareholder Equity. Lower = less financial risk.
- Current Ratio: Current Assets / Current Liabilities. Measures short‑term liquidity.
- EBITDA: Earnings Before Interest, Taxes, Depreciation, Amortisation.
- PEG Ratio: PE Ratio divided by earnings growth rate. Value indicator.
- Altman Z‑Score: Bankruptcy prediction score (higher = safer).
- EV/EBITDA: Enterprise Value / EBITDA. Valuation metric.
- RSI (Relative Strength Index): Momentum oscillator (0–100); >70 overbought, <30 oversold.
- Breakout Signal: Price moving above resistance, potential trend start.
- Mean Reversion Signal: Price likely to return to average.
- Technical Score: 0–10 composite of multiple technical indicators.
Methodology & Trust Disclosure
All calculations are performed on‑the‑fly using the formulas described above. Historical data is sourced from audited financial statements and Yahoo Finance. AI models are trained on 10+ years of market data and retrained weekly. No future data is leaked. Stock360s does not provide investment advice; the tool is for research and education. Past performance does not guarantee future results.
Author: Shailendra Saurav, Lead Product Analyst at Stock360s.
Reviewed by: Stock360s Research Team (March 2026).
Conclusion
Deep Analysis transforms stock research from a scattered chore into a structured, insight‑rich experience. By combining YoY fundamentals, QoQ momentum, peer benchmarking, seasonality, macro sensitivity, and explainable AI, Stock360s gives you the complete picture – not just the numbers.
Ready to analyse your first stock? Start Deep Analysis now → or try the interactive demo →