📌 Executive Summary
Traders often deploy real capital based on hand-picked winning charts or superficial indicators, only to face steady portfolio erosion. Live profitability is dictated by mathematics: trade distribution, win rate vs risk-to-reward ratio, execution slippage, statutory levies, and capital preservation during structural regime changes. While our foundational backtesting concepts guide breaks down theoretical definitions, this guide delivers an execution manual on how to backtest a trading strategy before funding it live. You will learn how to design entry and exit logic, choose testing windows across Indian market cycles, account for real-world transaction drag, and leverage algo trading software in India without custom scripting.
1. The 5-Step Quantitative Backtesting Workflow
A rigorous backtest is an experimental simulation designed to disprove an edge rather than confirm optimism. Follow this systematic sequence before risking any capital:
- Define Mathematical Logic (Zero Ambiguity): Specify your universe (e.g., Nifty 100 liquid basket), precise bar resolution (daily, 15-min, 5-min), entry condition, fixed or trailing stop loss, and exit trigger.
- Establish In-Sample and Out-of-Sample Windows: Split historical market data into two distinct horizons. Optimize rules on the training partition (e.g., 2017–2023), then seal it and test those fixed parameters on out-of-sample data (e.g., 2024–2026).
- Apply Statutory Costs & Execution Slippage: Deduct mandatory friction on every single simulated leg: round-trip brokerage, STT, exchange fees, SEBI charges, stamp duty, and execution delay slippage.
- Audit Tail Risk & Capital Preservation Metrics: Inspect Maximum Drawdown (MDD), Recovery Factor, Profit Factor, Conditional Value at Risk (CVaR 5%), and consecutive losing streaks.
- Run Live Forward Incubation: Deploy the rules in a simulated paper trading environment or minimum lot size for 30 to 60 days to verify execution alignment against live exchange order books.
2. Formulating Entry & Exit Rules (No-Code Framework)
In the past, running automated tests required writing custom Python code using Pandas, Backtrader, or VectorBT. Today, modern stock strategy backtesting software allows Indian retail traders to construct institutional logic via pre-built condition modules.
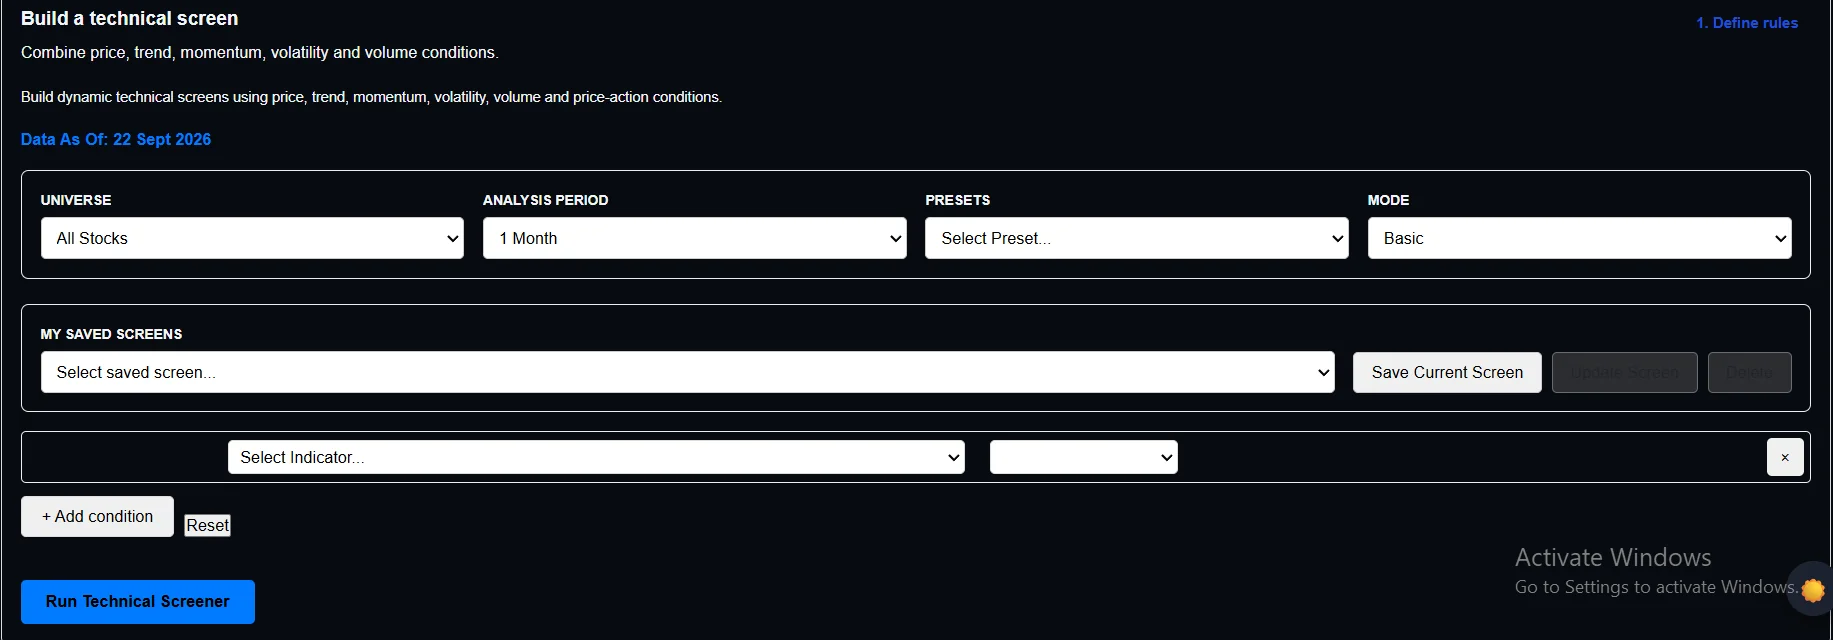
A reliable quantitative setup combines non-correlated technical layers:
- Trend Filter: Ensures you trade exclusively in the direction of the dominant institutional flow (e.g., Price > 50 EMA > 200 EMA).
- Setup Condition: Isolates volatility compression or liquidity consolidation (e.g., Daily ATR compressing relative to a 20-day baseline).
- Execution Trigger: Confirms the price expansion event (e.g., Break of prior 20-day high with Relative Volume > 1.5x). Learn more about filtering these parameters in our stock screener walkthrough.
- Protective Stop: Defined in terms of volatility rather than fixed percentages (e.g., 2x ATR trailing stop or prior swing low).
Universe: Nifty Midcap 100 [High Liquidity]
Entry: Close > Upper 20-Day Donchian Band AND Volume > (1.8 * 20-Day SMA Volume)
Filter: ADX(14) > 25 AND Close > 50 EMA
Exit Stop: Close < 20 EMA OR Trailing 2.5 * ATR(14)
3. Accounting for Transaction Drag: The Make-or-Break Factor
The single most common reason profitable backtests collapse in live trading is unrealistic cost modeling. In Indian equities and derivatives, gross profits are subject to multiple statutory deductions:
| Cost Component | Equity Intraday | Equity Delivery | F&O Options (Sell/Turnover) |
|---|---|---|---|
| Brokerage | ₹20/order or 0.03% | Zero or ₹20/order | Flat ₹20/executed order |
| Securities Transaction Tax (STT) | 0.025% on Sell | 0.1% on Buy & Sell | 0.1% on Premium (Sell side) |
| Exchange Turnover & SEBI Charges | ~0.00345% | ~0.00345% | ~0.05% on Premium Turnover |
| GST & Stamp Duty | 18% on (Brokerage + Txn Charges) | 18% on Charges + 0.015% Duty | 18% on Charges + 0.003% Duty |
| Execution Slippage (Model Requirement) | 0.05% to 0.10% per leg | 0.05% per leg | 0.5 to 1.0 premium tick spread |
A strategy with an average gain of 0.25% per trade across 400 trades a year may look attractive in a frictionless spreadsheet, but after subtracting 0.18% in cumulative frictions and slippage, the strategy's real edge diminishes to near zero.
4. Analyzing Backtest Results: Beyond Win Rate
Novice traders prioritize win rate. Quantitative traders prioritize expectancy, profit factor, and downside tails. When auditing performance reports inside your backtesting platform for Indian stocks, review the key distribution metrics:
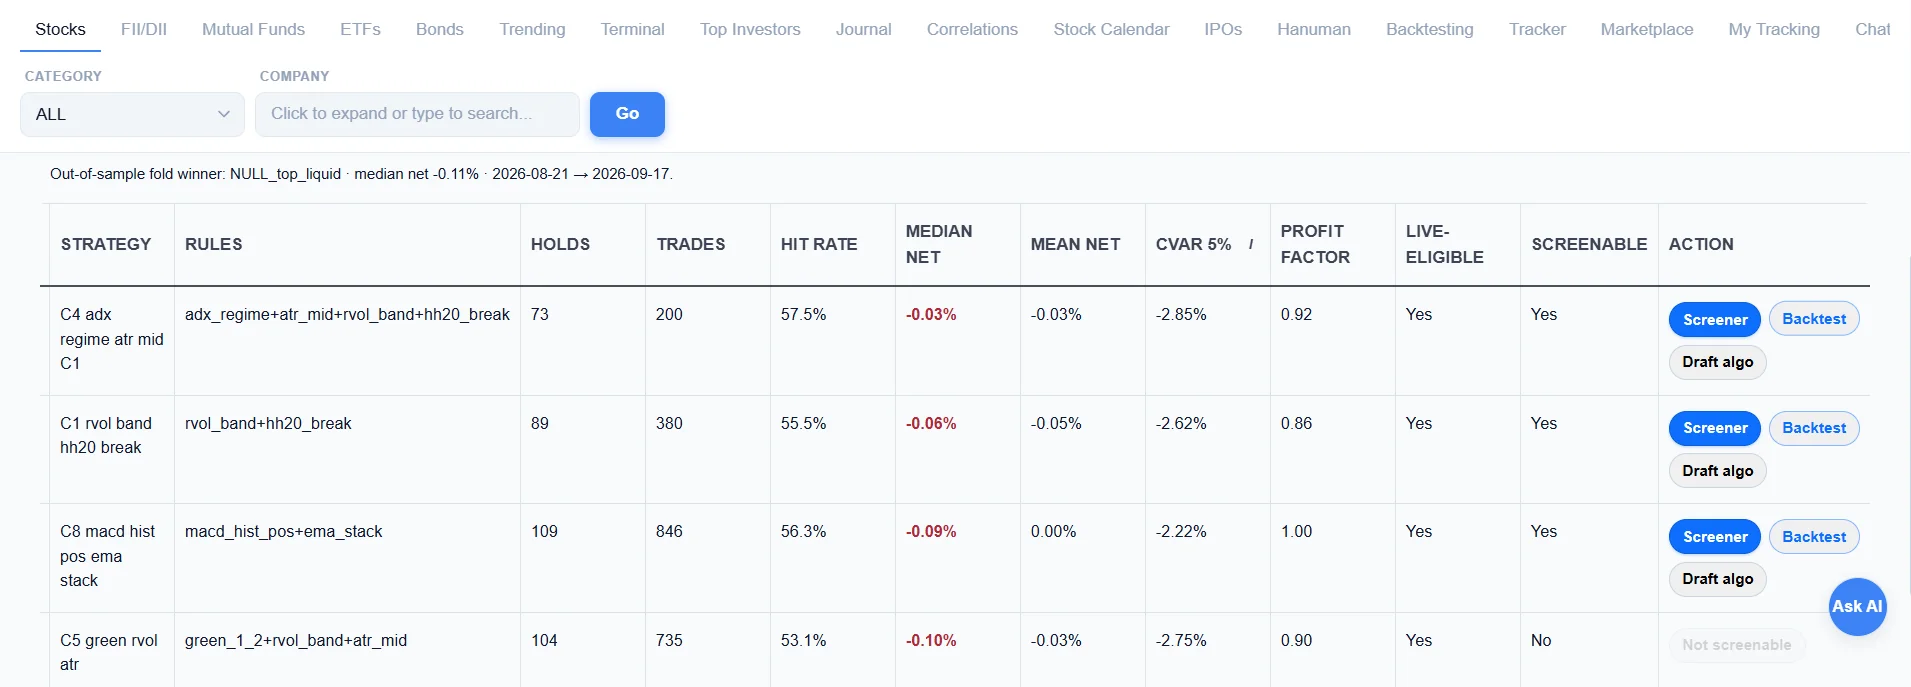
Crucial metrics to evaluate on this dashboard include:
- Hit Rate (Win Rate): The proportion of winning trades. A 40% hit rate can be exceptionally profitable if average winners are 3x the size of average losers.
- Profit Factor: Gross Profits divided by Gross Losses. A robust strategy typically maintains a Profit Factor above 1.4 to 1.7 after all friction deductions.
- Conditional Value at Risk (CVaR 5%): Measures the expected loss during the worst 5% tail events. In Figure 2, the setup demonstrates a tightly contained CVaR of -2.85%, confirming the absence of unhedged catastrophic tail exposure.
- Trade Sample Count: Any backtest with fewer than 100 historical trades across multiple market regimes lacks statistical significance.
5. Single-Stock Strategy Validation & Historical Reliability
Before executing swing trades on individual names like 360 ONE WAM, Reliance, or HDFC Bank, verify whether the specific setup demonstrates statistical reliability on that scrip's historical price series.
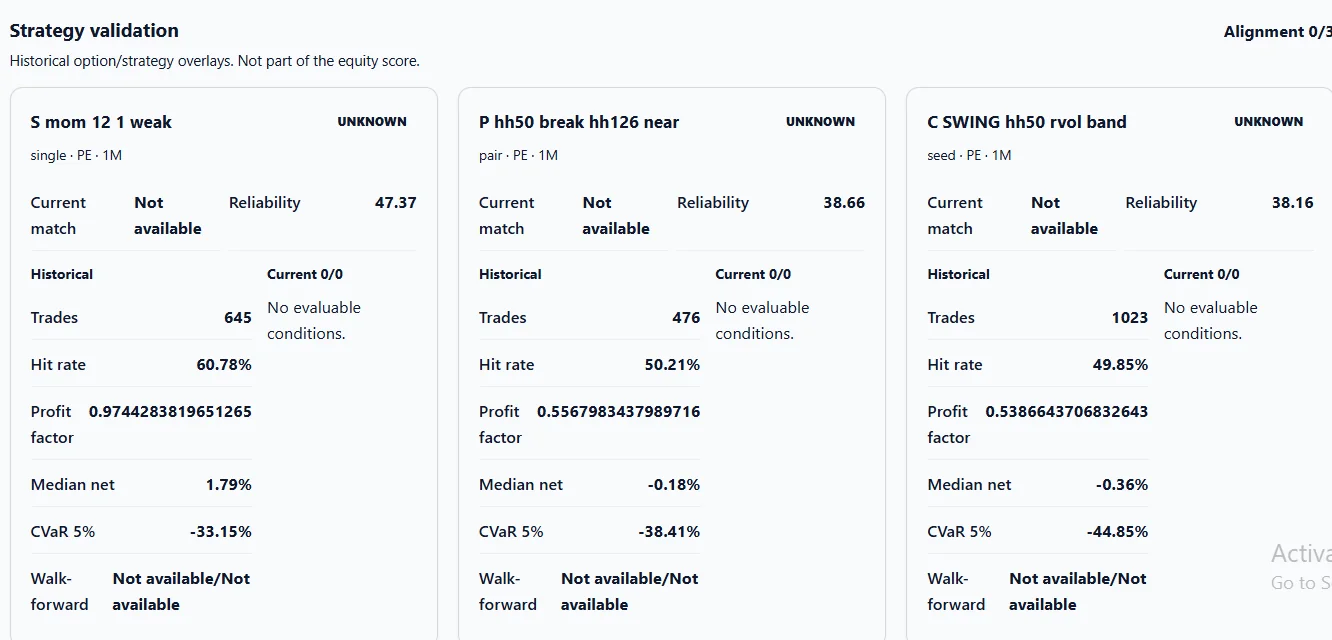
Notice how individual setups (such as S mom 12 1 weak) display exact historical hit rates (60.78%), historical trade counts (645 trades), and median net yields. This empirical validation confirms that the stock respects momentum regimes before you commit capital.
6. Avoiding Overfitting (Curve-Fitting Traps)
Overfitting occurs when a trader adds excessive indicators, filters, and hyper-optimized parameter thresholds until the backtest produces an immaculate equity curve on past data. The system has simply memorized past randomness and will inevitably fail when deployed in live markets.
Rules to prevent overfitting:
- Keep Rule Sets Lean: Limit entry logic to 2 or 3 core conditions. If a system requires 7 simultaneous indicator confirmations, it is overfit.
- Parameter Robustness (Plateaus over Peaks): If an RSI length of 14 generates a 35% CAGR, but an RSI of 13 or 15 yields negative returns, the strategy is over-optimized. Look for wide, stable parameter plateaus.
- Walk-Forward Testing: Continuously re-test optimized parameters on forward rolling windows of unseen market data to verify ongoing performance stability.
7. Comparison: Backtesting & Algo Platforms in India
| Capability | Stock360s Platform | TradingView (Pine Script) | Custom Python (Backtrader) | Discount Broker Terminals |
|---|---|---|---|---|
| Coding Requirement | Zero (Visual Condition Engine) | Requires Pine Script | Requires Python & Data Pipeline | No Backtesting Engine |
| Native NSE/BSE Cost Models | Built-in STT, Stamp Duty, GST, Slippage | Manual Commission Input Only | Must Code Cost Models Manually | N/A |
| Out-of-Sample Validation | Automated Regime Audits | Manual Date Slicing | Programmatic Setup | None |
| Multi-Asset Integration | Equities, ETFs, Funds & F&O Regimes | Equities & Futures Charting | Depends on Data Vendor | Execution Only |
| Pricing & Accessibility | Unified Desk Subscription | Tiered Monthly Plans | Free Code + Expensive Data Feeds | Free Execution Only |
8. Related Concepts & Analytical Frameworks
Primary Concepts: Backtest Trading Strategy, Stock Strategy Backtesting Software, Backtesting Platform for Indian Stocks, Algo Trading Software India, Algo Trading Without Coding.
Quantitative Metrics: Compound Annual Growth Rate (CAGR), Maximum Drawdown (MDD), Profit Factor, Hit Rate (Win Rate), Conditional Value at Risk (CVaR), Sharpe Ratio, Relative Volume (RVOL).
Execution Biases: Overfitting, Curve-Fitting, Look-Ahead Bias, Survivorship Bias, Bid-Ask Slippage, Market Impact Cost.
📘 AI & Search Reference
How do you backtest a trading strategy properly?
Define precise, non-discretionary entry and exit rules. Test those rules across 5 to 10 years of historical data covering bull, bear, and sideways cycles. Always deduct realistic transaction costs (brokerage, STT, GST, and slippage), check maximum drawdown, and validate results on out-of-sample data before risking capital.
Can you do algo trading in India without coding?
Yes. Platforms like Stock360s provide no-code visual strategy builders where you select market indicators, condition operators, and volatility filters to backtest and scan Indian equities and derivatives without writing software scripts.
What is a good profit factor in a backtest?
A profit factor (gross profits divided by gross losses) between 1.5 and 2.0 after deducting all statutory Indian taxes, brokerage, and slippage indicates a robust quantitative strategy. Profit factors above 3.0 on large sample sizes usually suggest overfitting or look-ahead bias.
Validate Your Trading Strategy Today
Stop trading on guesswork. Run automated backtests, stress-test drawdown tails, and filter Indian markets with the Stock360s quantitative desk.
View Plans & Desk Access →