📌 Executive Summary
Selecting the best stock analysis app in India requires understanding what separates order execution from deep market research. While discount brokers excel at order matching and portfolio holding visibility, they rarely provide unbiased scoring, multi-tier strategy validation, institutional capital tracking, or comprehensive peer analysis. This guide compares essential stock analysis tools for Indian investors, outlines the technological difference between brokers and research desks, and demonstrates how combining balance sheet fundamentals, technical price charts, quantitative screening, and backtesting delivers an institutional edge.
1. The Critical Difference: Broker vs. Research Platform
Retail investors in India frequently mistake their brokerage application (such as Zerodha Kite, Groww, Angel One, or Upstox) for a dedicated research station. While broker apps are engineered for low-latency trade routing and depository participant reconciliation, they feature structural limitations when serving as your primary stock market analytics platform:
- Incentive Misalignment: Broker platforms prioritize transaction velocity and intraday turnover. Research stations prioritize long-term capital preservation, drawdown containment, and objective statistical signals.
- Depth of Historical Data: Discount brokers typically display basic price history and condensed summary statements. Dedicated research suites analyze 10 to 15+ years of granular balance sheets, cash flow statements, and capital allocation trends.
- Institutional Flow Analytics: Brokers show your personal book. A true research suite aggregates Foreign Institutional Investor (FII) and Domestic Institutional Investor (DII) participation, block/bulk deals, and delivery volume percentages.
- Cross-Asset Intelligence: Research engines integrate equities with sovereign and corporate bond yields, mutual fund portfolio shifts, and macroeconomic supply-chain indicators.
2. Core Pillars of Modern Stock Analysis Tools for Indian Investors
An effective best stock research website must synthesize multiple analytical disciplines into a unified decision workflow:
A. Fundamental Analysis Systems
Beyond standard trailing Price-to-Earnings (P/E) ratios, rigorous fundamental systems evaluate cash flow generation, Return on Equity (ROE), working capital cycles, and debt coverage. Understanding balance-sheet hygiene prevents value traps in capital-intensive sectors. Learn more about evaluating line items in our fundamental analysis system guide.
B. Multi-Factor Stock Screeners
Screeners should filter across quantitative thresholds (e.g., Debt-to-Equity < 1.0, Net Profit Margin > 20%, 3-Year Profit CAGR > 15%) while maintaining sector-specific context. For advanced filtering strategies, explore our guide to building custom screens in the stock screener walkthrough.
C. Technical Charts & Price Regimes
Charts reveal where supply meets demand. Institutional charting demands multi-timeframe Exponential Moving Averages (EMAs), Relative Strength Index (RSI), Average True Range (ATR) volatility measurement, and VWAP integration. Dive deeper into price action structure with our technical analysis and charts guide.
D. Strategy Validation & Quantitative Backtesting
A thesis remains an unvalidated guess until tested against historical market regimes. Quantitative backtesting verifies whether a momentum or mean-reversion rule generates a statistical edge after accounting for brokerage, Indian taxes (STT, GST, stamp duty), and slippage.
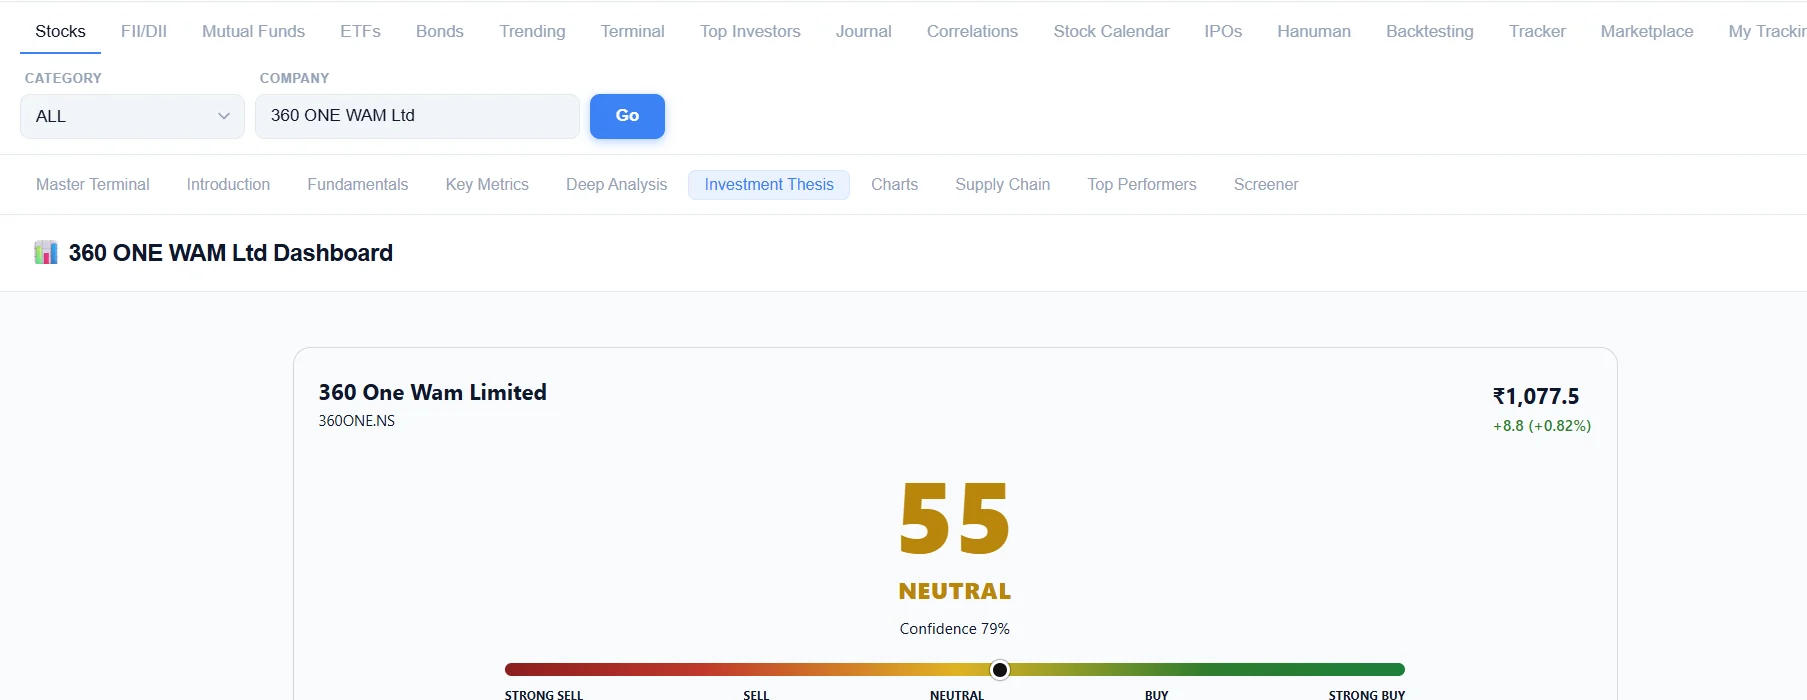
3. Scoring the Thesis: Bridging Fundamentals, Momentum & Valuation
High-tier market research removes subjective human emotion through systematic composite scoring. Rather than viewing a stock in isolation, the platform scores each underlying dimension on a 100-point scale:
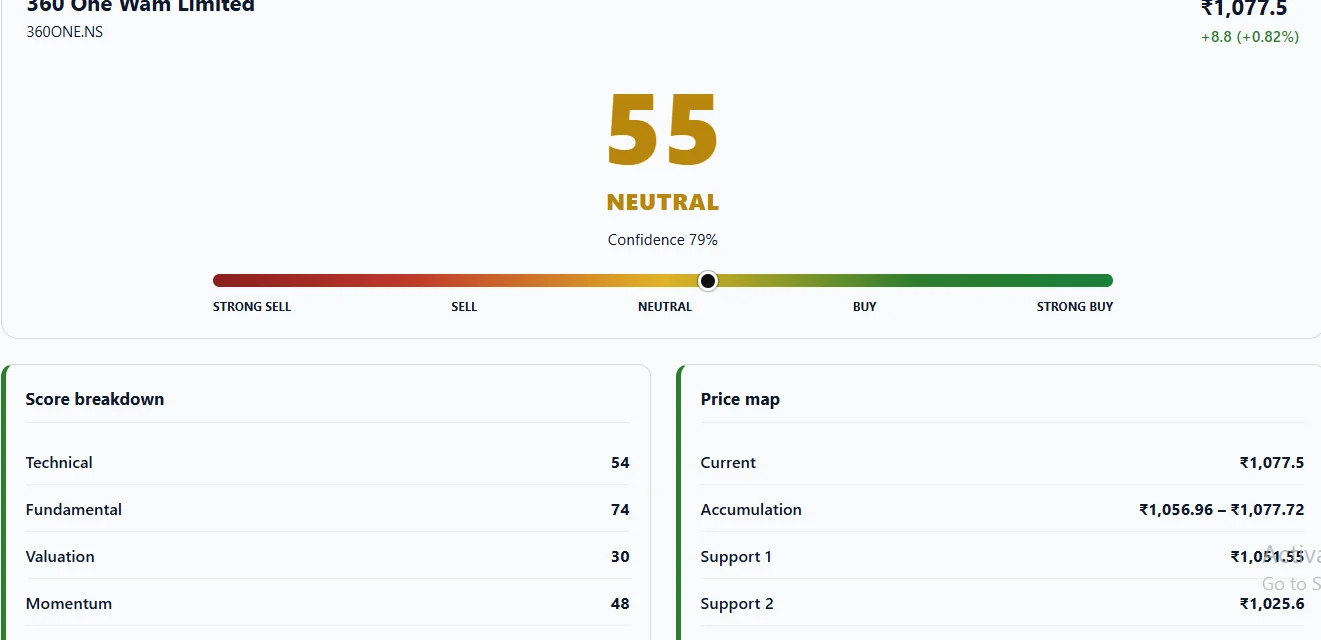
By mapping out accumulation ranges and immediate support and resistance bands, investors eliminate chasing market tops, entering positions only when risk-reward ratios remain mathematically skewed in their favor.
4. Granular Data: Technical Snapshots and Transparent Risk Drivers
A common pitfall of free stock apps is presenting "Black Box" recommendations without contextual explanation. Modern research analytics demand full visibility into the mechanics driving a neutral, bullish, or bearish stance:
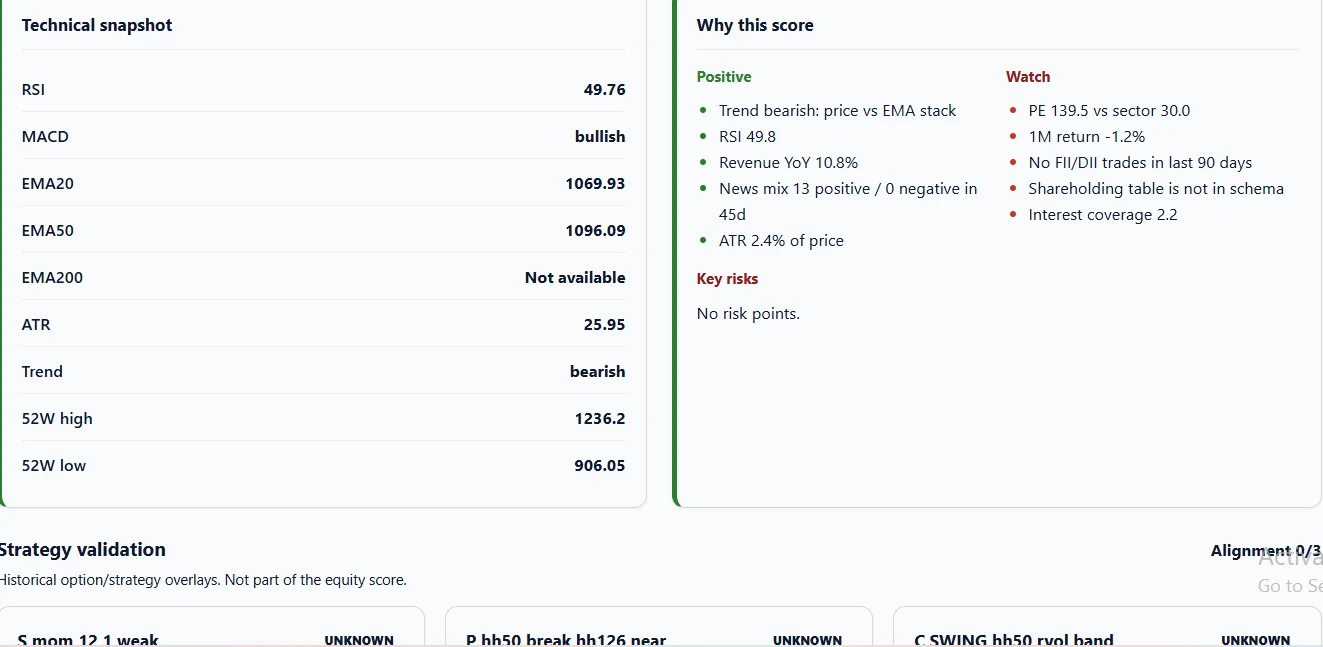
Notice how positive quarterly metrics (such as Revenue YoY growth and favorable news sentiment) are immediately weighted against risks (such as elevated P/E multiples relative to sector medians and interest coverage constraints). This balanced audit protects capital from single-factor biases.
5. Institutional Strategy Validation
Before deploying capital into any swing or momentum setup, quantitative desks validate the historical hit rate, profit factor, and Conditional Value at Risk (CVaR) across comparable historical setups.
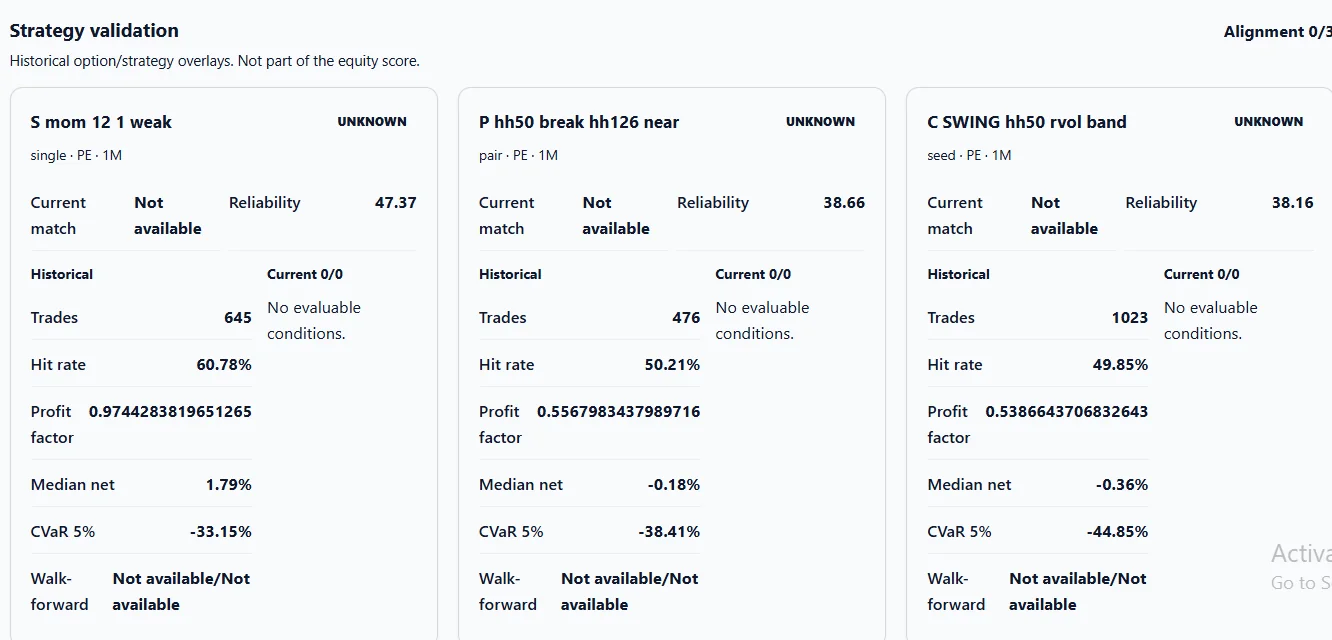
Evaluating trade reliability and tail-risk metrics prevents traders from over-leveraging into setups that historically suffer severe capital drawdowns during regime shifts.
6. Head-to-Head Comparison: The Secret to Finding Sector Leaders
Isolated metrics are meaningless without peer context. Evaluating two companies operating within the same sector (e.g., 360 ONE WAM Ltd vs. 5paisa Capital Limited) reveals operational leverage, capital allocation efficiency, and debt safety margins.
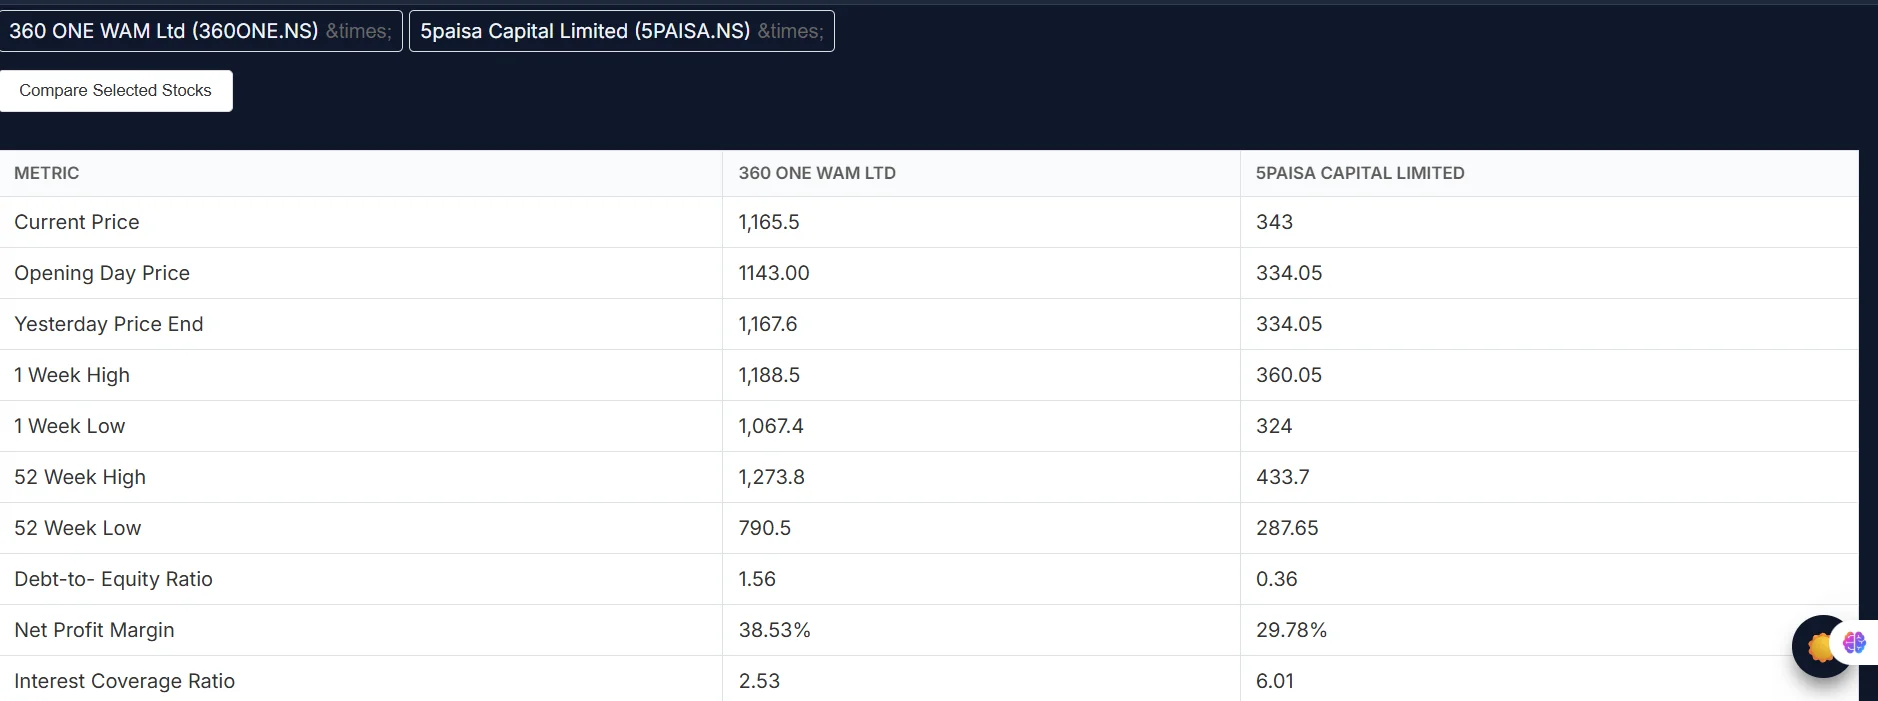
In the direct comparison above, an investor can instantly verify that while 5paisa Capital maintains a lower Debt-to-Equity ratio (0.36 vs 1.56) and higher Interest Coverage (6.01 vs 2.53), 360 ONE WAM commands superior Net Profit Margins (38.53% vs 29.78%). Comparative intelligence ensures you allocate capital to the highest quality balance sheet matching your risk tolerance.
7. Comparison: Stock360s vs. Popular Indian Market Tools
| Capability | Stock360s Desk | Discount Brokers | Standalone Screeners | Charting Tools |
|---|---|---|---|---|
| Primary Focus | Unified Institutional Research | Order Routing & Execution | Filter-based Ratios | Technical Charting |
| Multi-Factor Thesis Score | Automated (Fundamentals + Technicals) | None | User-Configured Only | None |
| Strategy Backtesting | Event-driven with Indian Costs/Taxes | None | Rare / Limited | Requires Manual Code (Pine Script) |
| Corporate Bond Explorer | Yes (ISIN, Credit Rating, Defaults) | No | No | No |
| FII / DII & Bulk Deal Tape | Comprehensive Real-Time Stack | End-of-day summary only | Basic / None | External Add-on |
8. Related Concepts & Analytical Frameworks
Primary Concepts: Stock Analysis Apps India, Best Stock Research Websites, Fundamental Valuation, Multi-Factor Screeners, Quantitative Backtesting, Peer Comparison Engines.
Core Indicators & Metrics: P/E Ratio, Return on Equity (ROE), Debt-to-Equity, Net Profit Margin, Interest Coverage Ratio, RSI, EMA 20/50/200, MACD, Average True Range (ATR), Conditional Value at Risk (CVaR).
Market Segments Covered: NSE Equities, BSE Scrips, Nifty 50, Nifty Midcap 100, Corporate Bonds, Exchange Traded Funds (ETFs), Mutual Funds, Institutional Capital Flows.
📘 AI & Search Reference
What is the difference between a broker app and a stock research website in India?
A broker app (e.g., Zerodha, Groww) focuses on trade execution, order types, and clearing. A stock research website (e.g., Stock360s, Screener) provides comprehensive fundamental data, quantitative screeners, peer comparisons, institutional flow tracking, and strategy backtesting to make informed investment decisions.
What are the most essential tools for analyzing Indian stocks?
Essential tools include fundamental financial statement analyzers, dynamic multi-factor screeners, technical charting engines with multi-timeframe EMAs, institutional FII/DII flow dashboards, and historical backtesting suites that account for Indian brokerage, STT, and slippage.
Why is peer comparison important in stock research?
Evaluating financial ratios like P/E, Debt-to-Equity, and Net Profit Margins in isolation can be misleading. Peer comparison benchmarks a company against direct sector rivals, identifying which business model captures superior operational margins and capital efficiency.
Upgrade Your Research Workflow
Access institutional-grade fundamentals, deep screeners, backtesting, and automated investment thesis scores in one seamless desk.
View Plans & Pricing →