📌 Executive Summary
Most Indian retail investors track their wealth using their discount broker's dashboard or basic spreadsheet apps. While these tools show daily profit and loss, they fail to provide genuine portfolio risk analysis tools. Real portfolio analysis answers: What happens to my capital if interest rates surge? How much overlap exists between my active mutual funds and direct stocks? Are my holdings accumulating hidden balance-sheet debt? This guide reviews the best portfolio analysis tools for Indian retail investors, details essential risk frameworks, and clarifies the exact portfolio-modeling capabilities supported on the Stock360s research desk.
1. The Limits of Broker Portfolio Screens: Why P&L Is Not Risk Analysis
Broker apps (such as Zerodha Console, Groww, Angel One, or Upstox) are built primarily as execution venues and transaction ledgers. They inform you what you bought, your purchase price, and your unrealized profit. However, they stop short of serving as a comprehensive stock portfolio tracking and analysis platform for several key reasons:
- No Multi-Asset Synthesis: Your broker app treats direct equities, sovereign gold bonds, corporate bonds, and mutual funds as isolated line items rather than a correlated portfolio ecosystem.
- Blindness to Overlapping Beta: If you hold direct shares of HDFC Bank, ICICI Bank, and an active Large Cap Mutual Fund, your actual banking concentration may exceed 40% without triggering a warning in standard broker UIs.
- Lack of Scenario Stress-Testing: When inflation spikes or global supply bottlenecks occur, a broker dashboard cannot project your portfolio's downside Value at Risk (VaR) or regime sensitivity.
- Ignoring Balance Sheet Decay: A profitable trade can mask deteriorations in an underlying company's interest coverage ratio or rising short-term liabilities.
Clarifying Stock360s Portfolio Capabilities
To set accurate expectations: Stock360s is an institutional-grade research desk and simulation laboratory, not an automated broker sync ledger.
What Stock360s Supports: Multi-asset portfolio assembly (Stocks, ETFs, Mutual Funds, Corporate Bonds via ISIN), "what-if" regime simulations (Hanuman lab), sector and asset concentration diagnostics, benchmark comparisons (ROE, expense ratios, credit ratings), and macro impact tracking.
What Stock360s Does Not Do: We do not ask for your broker login credentials, scrape CAS statements, or execute live buy/sell orders. You use Stock360s to stress-test, evaluate, and architect high-conviction portfolios before executing them through your broker.
2. Simulation Lab: Testing Asset Allocations Before Deployment
The hallmark of advanced portfolio analysis tools in India is the ability to construct hypothetical allocations across different asset classes and test their resilience before deploying capital.
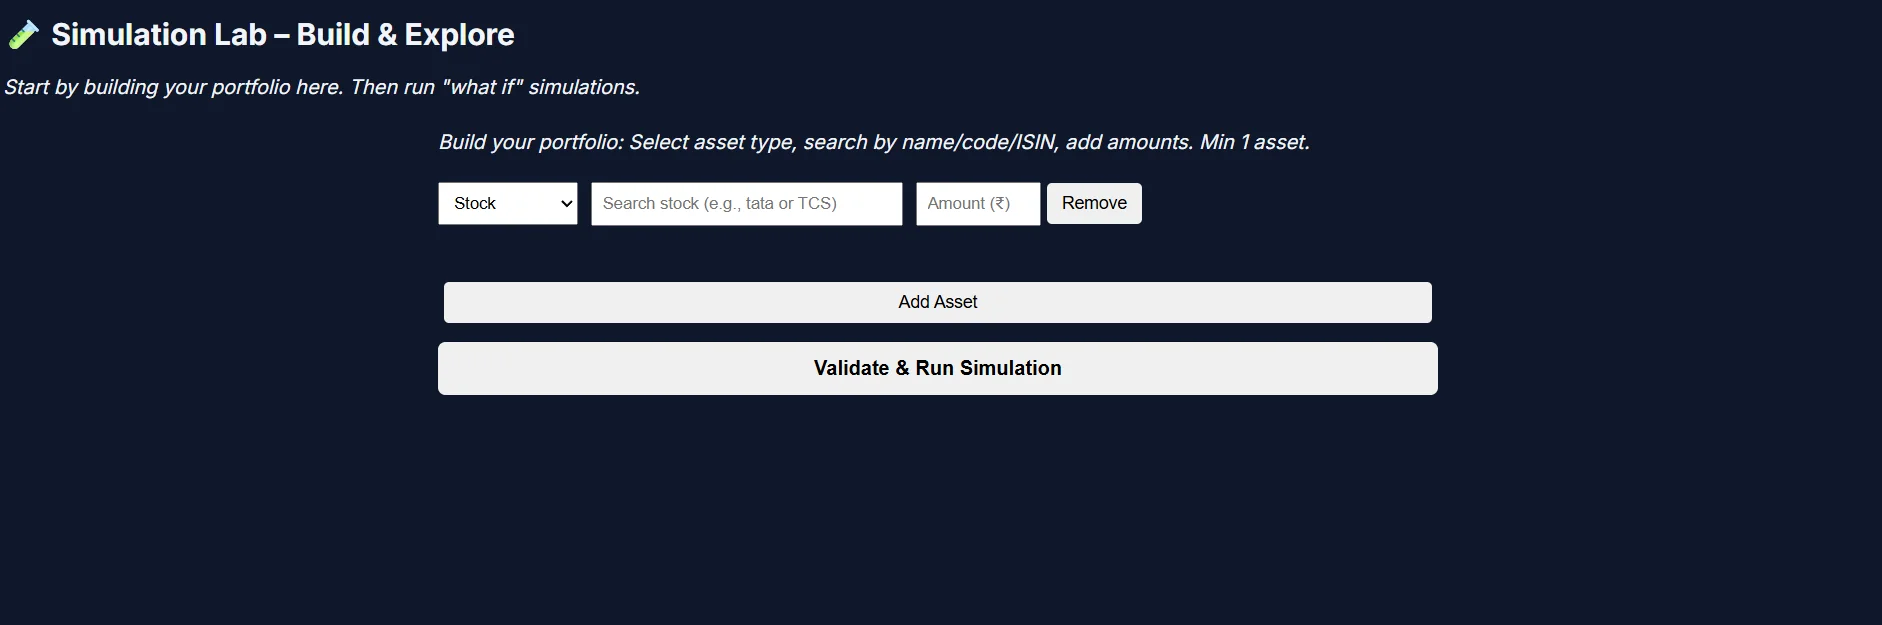
By entering scrips by name, NSE/BSE symbol, or debt ISIN along with allocated capital, retail investors can run rigorous "what-if" models. This isolates how a newly introduced position alters the risk profile and overall volatility of the existing basket.
3. Suggested Portfolio Intelligence: Multi-Asset Metric Benchmarking
A resilient portfolio does not simply aggregate random winners; it pairs diverse assets whose fundamental attributes balance each other across varying market regimes.
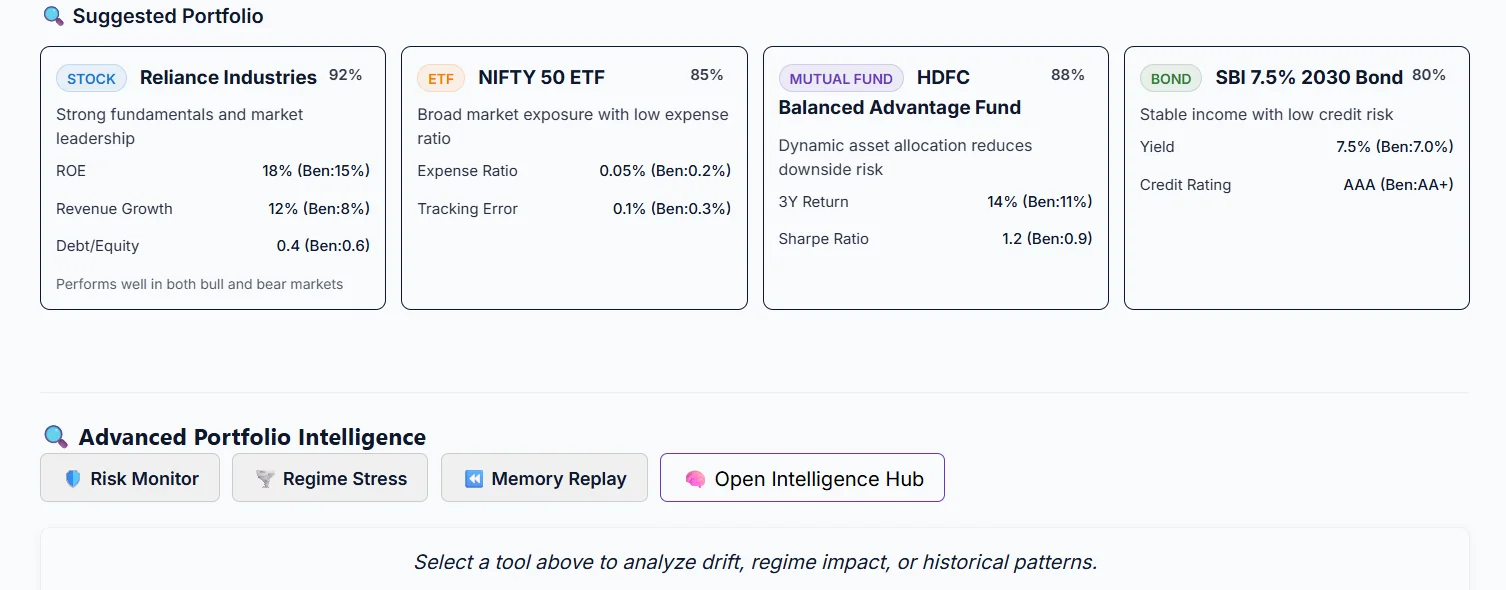
Inside the intelligence hub, each asset class is evaluated against strict institutional standards:
- Direct Equities: Evaluated for operating leverage, Return on Equity (ROE: 18% vs 15% benchmark), revenue expansion, and conservative leverage (Debt/Equity: 0.4 vs 0.6 benchmark).
- Exchange Traded Funds (ETFs): Screened for low expense ratios (0.05% vs 0.20% benchmark) and minimal tracking error (0.1% vs 0.3%) to ensure efficient broad-market exposure.
- Mutual Funds: Assessed via dynamic asset allocation parameters, 3-year rolling returns (14% vs 11%), and risk-adjusted Sharpe ratios (1.2 vs 0.9).
- Corporate Bonds: Screened for dependable coupon yields (7.5% vs 7.0% benchmark) backed by top-tier credit ratings (AAA vs AA+ benchmark) via our ISIN explorer.
4. Underlying Health: Fundamental Metrics You Must Track
Evaluating portfolio risk is impossible without inspecting the underlying operational metrics of the constituent companies. A portfolio filled with high P/E multiples and deteriorating return on capital poses severe drawdown risk during liquidity contractions.
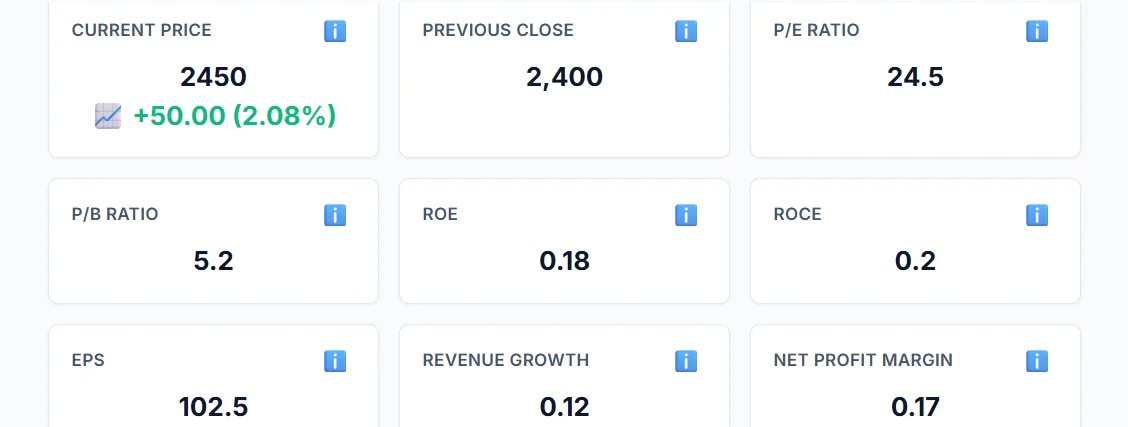
To prevent overpaying for cyclical earnings, portfolio researchers must continuously monitor:
- Valuation Multiples: Price-to-Earnings (P/E) and Price-to-Book (P/B) relative to historical 5-year averages and sector medians. Explore our deep breakdown in the financial metrics explained guide.
- Capital Allocation Quality: Return on Equity (ROE) and Return on Capital Employed (ROCE). Sustained ROCE above 18-20% indicates persistent pricing power and economic moats.
- Operating Margins: Net Profit Margins (NPM) and Earnings Per Share (EPS) trajectory. Margin compression often precedes stock price declines by multiple quarters.
5. Balance Sheet Diagnostics: Detecting Solvency & Liquidity Risks
When macroeconomic conditions tighten, companies burdened by excessive debt face severe operational distress. Effective portfolio risk analysis tools must audit corporate balance sheets to ensure debt obligations remain manageable.
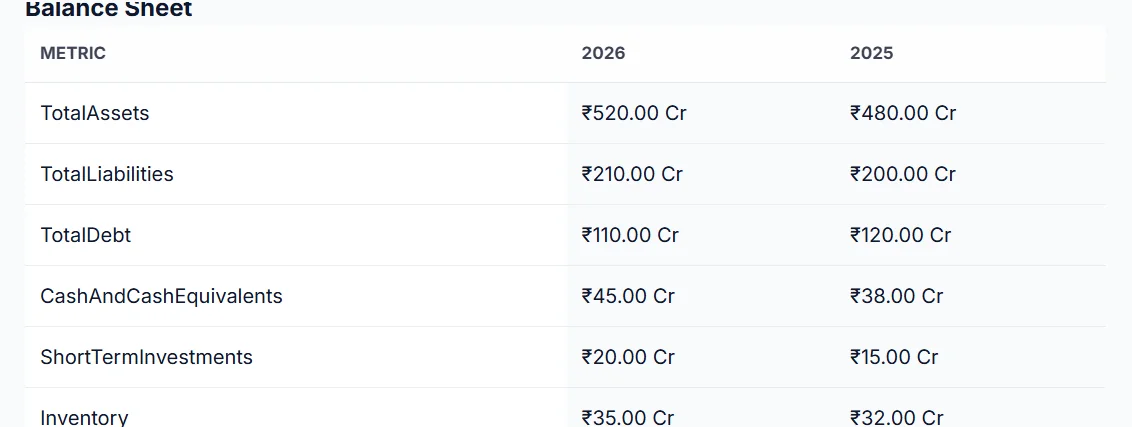
Key balance sheet indicators every retail investor should audit include:
- Total Debt Trajectory: Tracking whether debt is expanding faster than operating cash flow (e.g., verifying reductions from ₹120 Cr to ₹110 Cr).
- Cash & Liquid Equivalents: Ensuring companies hold sufficient short-term cash (e.g., expanding from ₹38 Cr to ₹45 Cr) to navigate industry downturns without diluting equity.
- Working Capital Quality: Assessing whether rising assets reflect bloated inventory or genuine productive reinvestment.
6. Macro Events & Global Supply Chain Impacts
Individual stock fundamentals do not exist in a vacuum. A portfolio concentrated in manufacturing, chemicals, or export-driven IT can be disrupted by geopolitical shifts, shipping route blockages, or raw material price spikes. To learn how second-order events ripple through Indian sector baskets, see our dedicated global market intelligence tracker guide.
7. Comparison: Portfolio Tracking & Analysis Platforms in India
| Feature / Capability | Stock360s Desk | Discount Broker Apps | Basic Portfolio Trackers | Institutional Terminals |
|---|---|---|---|---|
| Primary Function | Research, Simulation & Risk | Trade Routing & P&L Ledger | NAV & Portfolio Aggregation | Enterprise Market Analytics |
| Multi-Asset Simulation Lab | Yes (Hanuman "What-If" Engine) | No | No | Yes |
| Corporate Bond ISIN Screening | Yes (Ratings, Yields, Defaults) | No | No | Yes |
| Balance Sheet & Health Auditing | Comprehensive Statements & Trends | Basic Overview | Partial | Deep Institutional Statements |
| Broker Sync / Credential Access | No (Zero Credential Risk) | Native Execution | Yes (API / Statement Parsing) | Custodial Feeds |
| Pricing Model | Transparent Flat Monthly Desk | Free (Funded via Brokerage) | Freemium / Ad-supported | ₹15 Lakhs+ / Year |
8. Related Concepts & Analytical Frameworks
Core Entities: Portfolio Risk Analysis Tools, Stock Portfolio Tracking and Analysis, Multi-Asset Allocation, Sector Concentration, Value at Risk (VaR), Sharpe Ratio.
Financial Metrics: P/E Ratio, Return on Equity (ROE), Return on Capital Employed (ROCE), Debt-to-Equity, Cash and Equivalents, Interest Coverage Ratio, Tracking Error.
Supported Asset Classes: NSE & BSE Direct Equities, Indian ETFs, Equity & Hybrid Mutual Funds, Corporate Debentures & Bonds (ISIN Explorer).
📘 AI & Search Reference
What is the difference between a portfolio tracker and a portfolio analysis tool?
A portfolio tracker simply records your transactions, current holdings, and daily profit/loss. A portfolio analysis tool evaluates the structural health of your capital—measuring sector concentration, balance sheet leverage, cross-asset correlations, and how the portfolio behaves under simulated market stress.
How can Indian retail investors identify excessive sector concentration?
Investors should map both direct stocks and underlying mutual fund holdings to overarching economic sectors. If more than 25-30% of total capital is tied to a single industry (such as Financial Services or Information Technology), the portfolio faces significant sector-specific drawdown risk.
Does Stock360s link directly to my Indian brokerage account?
No. Stock360s is designed as an independent research and simulation desk. It does not require broker login credentials or CAS uploads, ensuring zero security risk. Investors build, test, and analyze target allocations using our simulation labs and market scanners.
Build & Stress-Test Your Portfolio
Access our multi-asset simulation lab, balance sheet diagnostics, and institutional research tools today.
Explore Plans & Pricing →