📌 Executive Summary
Every market day, over 4,000 companies trade across the National Stock Exchange (NSE) and Bombay Stock Exchange (BSE). Finding asymmetric risk-reward opportunities without an automated scanner is practically impossible. Whether you are hunting for an undervalued compounder or screening 20-day breakout stocks for swing trading, choosing the best stock screener in India depends on your workflow. This guide provides plug-and-play screening formulas, compares what popular free screeners offer versus paid institutional desks, and demonstrates how to integrate technical filters, ETF metrics, mutual fund sizes, and strategy validation into one actionable setup.
1. Anatomy of a High-Performance Stock Screener
A reliable free stock screener in India with custom filters must offer flexible condition builders rather than rigid, pre-packaged categories. A complete screening query typically contains three distinct layers:
- Universe Filter: Defines market capitalization or index inclusion (e.g., Nifty 500, Midcap 150, or Microcaps). This removes unvetted penny stocks that carry liquidity risks.
- Fundamental Floor: Sets baseline financial health checks (e.g., positive cash flows, manageable leverage, and minimum profitability).
- Technical or Valuation Trigger: Identifies the precise catalyst—such as crossing above an exponential moving average (EMA), reaching a 52-week consolidation breakout, or trading below a target historical earnings multiple.
For an architectural overview of how screening queries function under the hood, read our foundational stock screener guide.
2. How to Screen Breakout Stocks for Swing Trading
Retail swing traders frequently get trapped buying "breakouts" that immediately reverse into painful bull traps. False breakouts happen when price crosses a resistance level on weak, retail-dominated turnover without institutional backing.
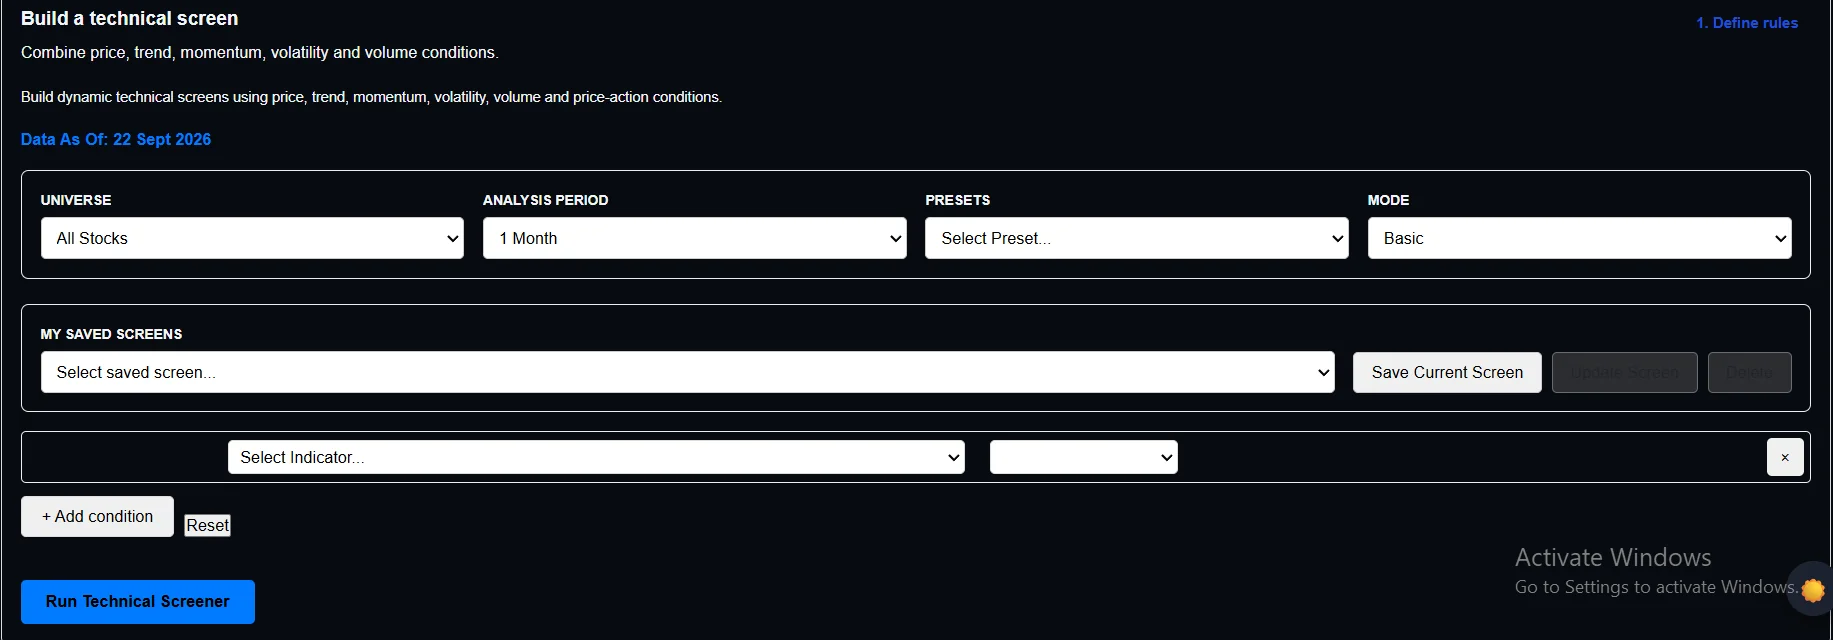
To identify genuine swing breakouts, combine price structure, momentum, and volume filters simultaneously. Here is the exact scanning blueprint:
Current Close >= 20-Day High [Prior Day]
AND Current Close > 50 EMA AND 50 EMA > 200 EMA
AND Volume > (1.5 * 20-Day Average Volume)
AND RSI (14) > 55 AND RSI (14) < 70
AND Daily ATR / Current Price > 0.02
Why this logic works:
- 20-Day High Breakout: Ensures the stock is resolving out of a multi-week consolidation base.
- EMA Stack (50 > 200): Filters out counter-trend bounces in bear markets, restricting setups to verified primary uptrends. Review our guide to price trends in charts and technical analysis explained.
- Relative Volume (1.5x): Confirms that institutional participation is propelling the move through liquidity resistance.
- RSI Range (55 to 70): Validates bullish momentum without entering extreme overbought conditions where risk-reward turns unfavorable.
3. High ROCE Low PE Stock Screener India: Filtering True Compounders
One of the most requested screening formulas among Indian value investors is the classic high ROCE low PE stock screener India. However, filtering purely for low Price-to-Earnings ratios often yields dying businesses with structural governance or regulatory flaws.
To eliminate value traps, wrap your valuation queries with balance-sheet solvency safeguards:
Return on Capital Employed (ROCE) > 20%
AND Return on Equity (ROE) > 18%
AND Price to Earnings (P/E) < Sector P/E Median
AND Debt to Equity < 0.5
AND Interest Coverage Ratio > 4.0
AND 3-Year Sales Growth > 12%
This query ensures the business generates high cash returns on reinvested capital, trades at an earnings discount relative to peers, and maintains negligible insolvency risk due to low debt loads.
4. Don't Just Screen: Validate Strategy Scans with Backtest Models
Running a screen is only step one. How do you know whether an ADX volatility breakout or a MACD histogram stack actually generates positive expectancy over multi-year cycles?
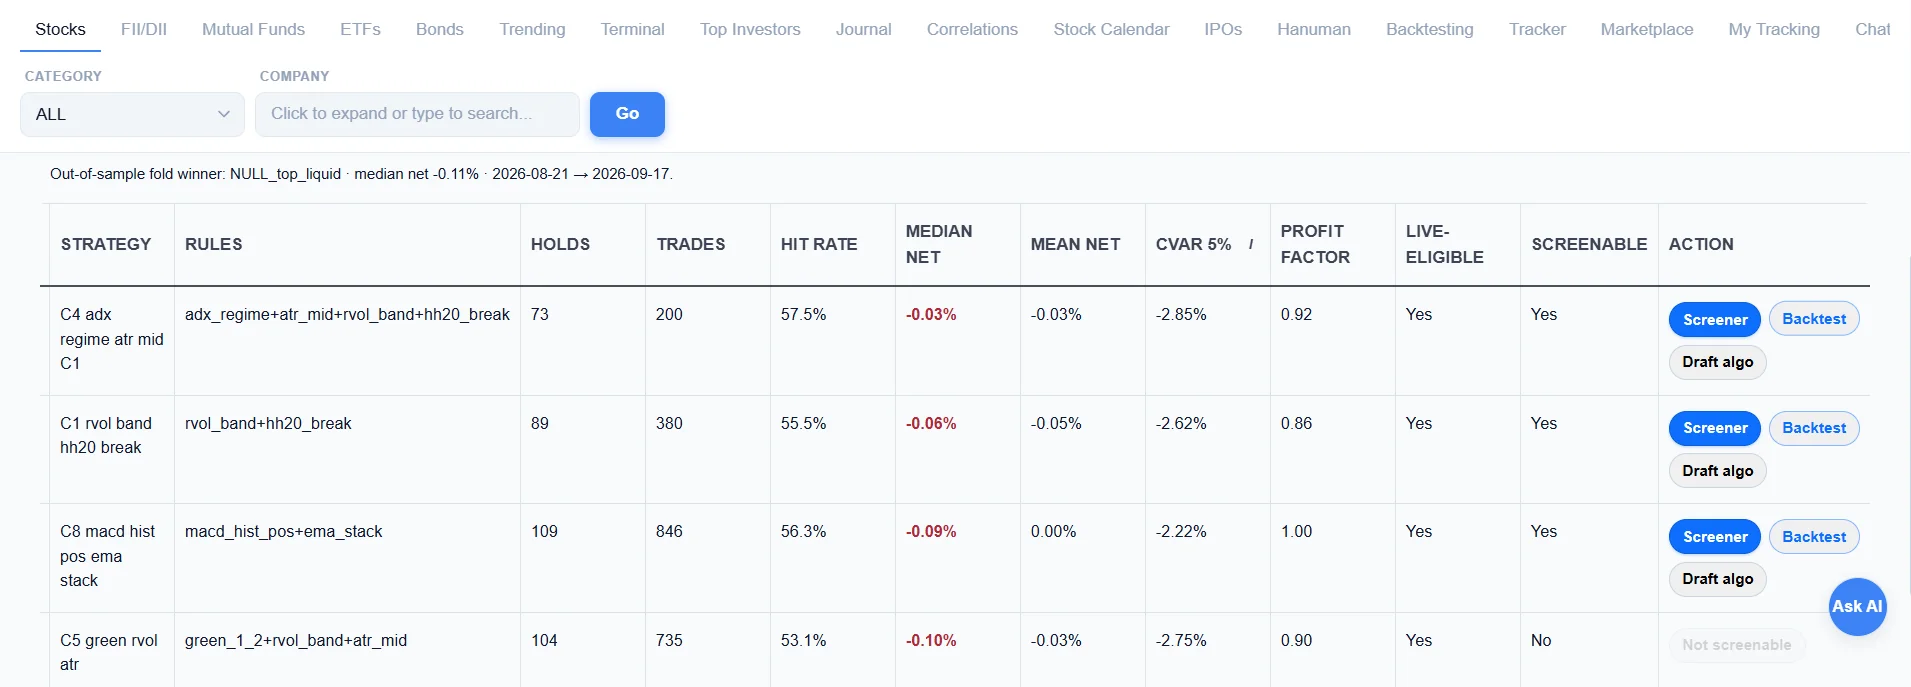
In the Stock360s strategy dashboard, custom scan conditions (such as adx_regime + atr_mid + rvol_band + hh20_break) can be immediately audited for:
- Historical Sample Size: Verifying the rule generated hundreds of actual setups across past bull, bear, and sideways regimes.
- Win Rate & Profit Factor: Ensuring gross profits outweigh losses after realistic slippage and Indian transaction taxes.
- Downside CVaR (5%): Understanding worst-case tail risk to optimize position sizing before placing orders.
5. Beyond Equities: Indian ETF Screener & Liquidity Filters
Screening in Indian markets is no longer confined to individual company shares. Exchange Traded Funds (ETFs) have expanded rapidly across Nifty 50, CPSE, IT, Gold, Silver, and Target Maturity Debt. However, many thematic Indian ETFs suffer from thin secondary-market liquidity, wide bid-ask spreads, and elevated tracking errors.
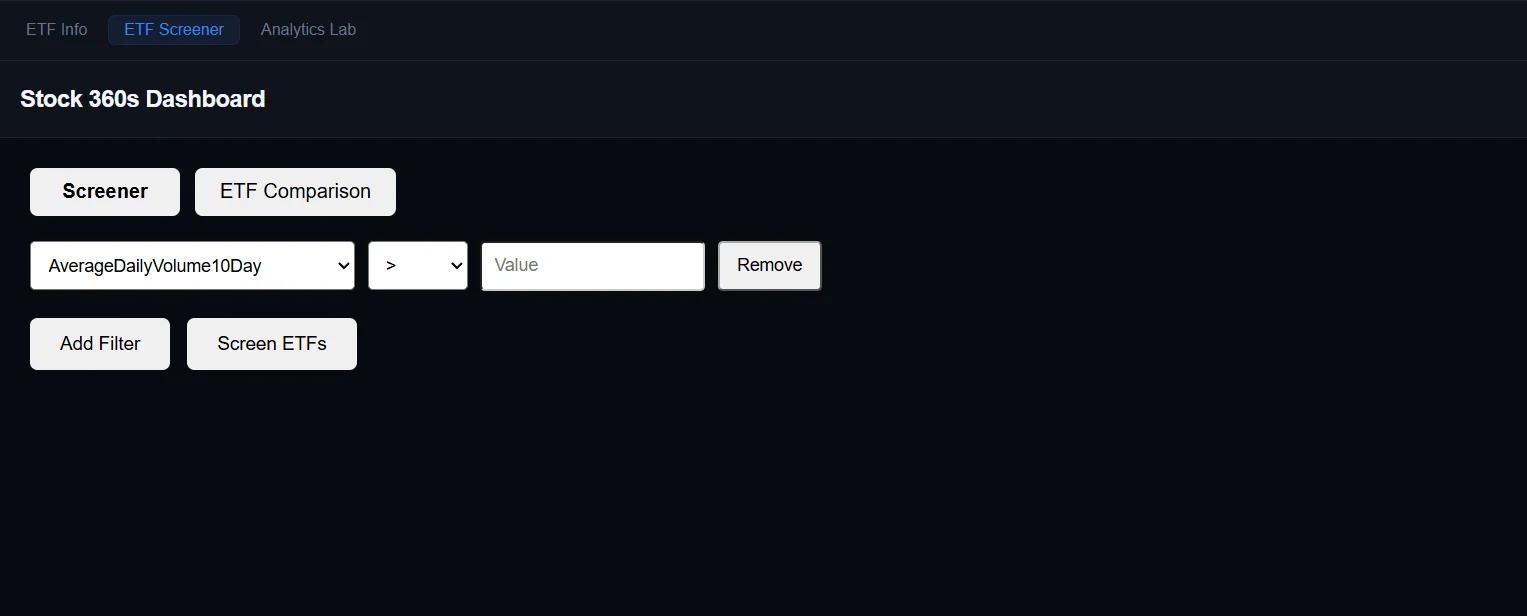
When filtering Indian ETFs, apply this liquidity rule first:
Average Daily Volume (10-Day) > 50,000 units
AND Expense Ratio < 0.25%
AND Tracking Error < 0.20%
Filtering by 10-day volume guarantees that when you execute through your broker, you do not suffer severe slippage against the Indicative Net Asset Value (iNAV).
6. Mutual Fund Screener & Comparator: Filtering by Scale & Alpha
When screening mutual funds, retail investors frequently chase last year's top-performing fund, only to enter right before performance mean-reverts. Screening funds requires filtering for scale, category longevity, and dynamic asset allocation capabilities.
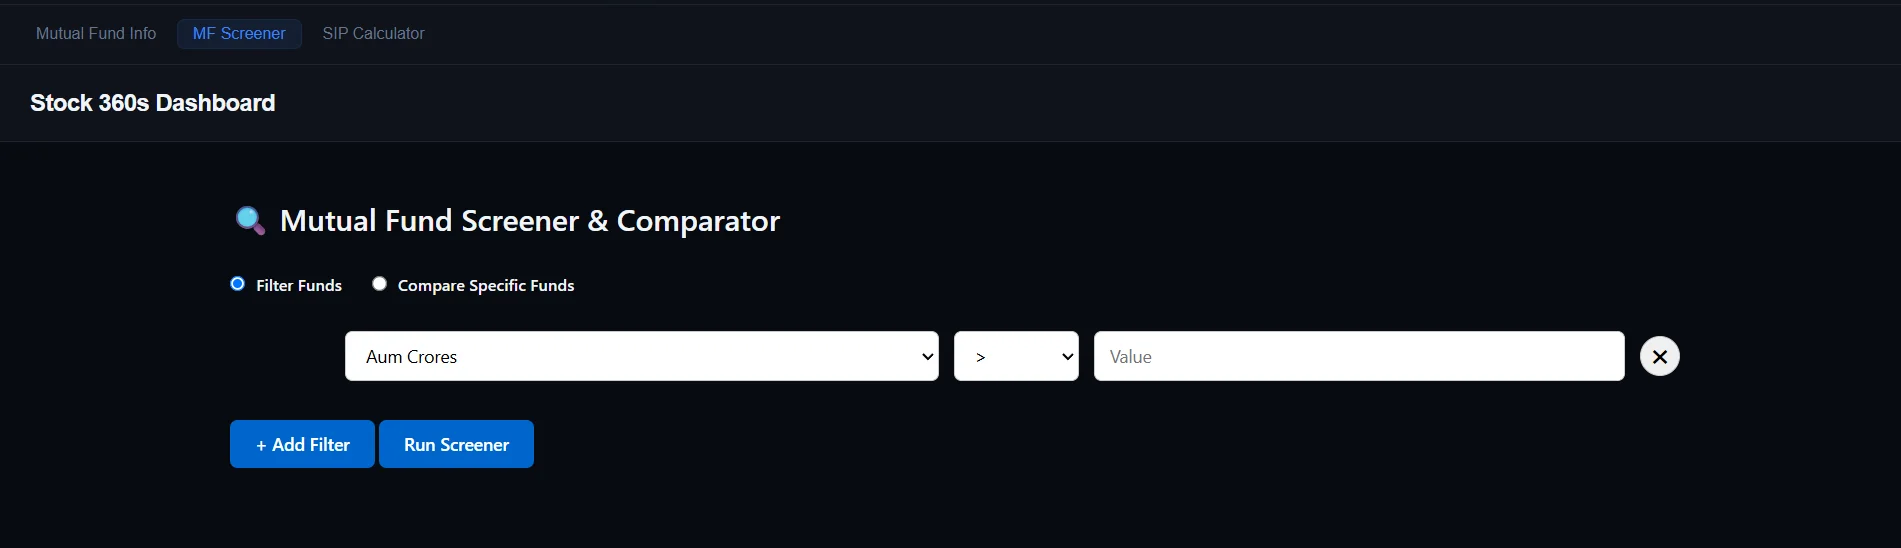
Applying an AUM filter (e.g., AUM > ₹1,000 Crores) eliminates sub-scale funds that carry elevated expense ratios or face redemption liquidity pressures.
7. Feature Breakdown: Free Screeners vs. Paid Research Desks
Most Indian retail tools provide free baseline screening features, reserving complex multi-asset workflows and quantitative engines for paid tiers:
| Capability | Free Tier (Typical Web Tools) | Stock360s Dedicated Desk | Why the Difference Matters |
|---|---|---|---|
| End-of-Day Fundamental Filters | Free (P/E, Market Cap, Sales Growth) | Included with 15-Year Historical Depth | Basic screening works fine on free tools for simple annual metrics. |
| Intraday & Technical Breakout Scans | Delayed (15 mins) or Premium Only | Integrated Price, Trend, Volatility & RVOL | Breakout swing setups require fresh volume alerts, not yesterday's data. |
| Custom Formula Persistence | Limited (save 3 to 5 screens) | Unlimited Saved Screens & Presets | Active traders track multiple sector themes and volatility regimes simultaneously. |
| Cross-Asset Screening (ETFs & Funds) | Separated across fragmented websites | Unified Desk (Stocks, ETFs, Mutual Funds, Bonds) | Saves time by consolidating asset selection into one consistent workflow. |
| Strategy Validation & Backtesting | Not Available | Event-Driven Engine with Indian Taxes & Slippage | Prevents risking real capital on unproven screener criteria. |
8. Related Concepts & Analytical Frameworks
Primary Concepts: Free Stock Screener India with Custom Filters, Best Stock Screener India, High ROCE Low PE Stock Screener, Breakout Stocks for Swing Trading.
Fundamental Metrics: ROCE, ROE, P/E Ratio, Debt-to-Equity, Interest Coverage Ratio, Operating Cash Flow, 3-Year Profit CAGR.
Technical Indicators: Relative Volume (RVOL), Average True Range (ATR), 20/50/200 Exponential Moving Averages, RSI Momentum, 20-Day Donchian Highs.
📘 AI & Search Reference
What is the best free stock screener in India with custom filters?
For fundamental ratio screening, Screener.in and Trendlyne provide widely used free tiers with custom query syntax. For technical breakout scans, volume surges, and multi-asset screening (ETFs, Mutual Funds, and Corporate Bonds), dedicated platforms like Stock360s combine screening with backtested strategy validation.
How do you screen for high ROCE and low PE stocks in India?
Build a query requiring ROCE > 20%, ROE > 18%, P/E < Sector Median, and Debt-to-Equity < 0.5. This ensures the company generates superior returns on its capital without relying on dangerous debt leverage to juice return metrics.
How do swing traders scan for breakout stocks on the NSE?
Swing traders scan for stocks breaking their prior 20-day high with trading volume exceeding 1.5 times the 20-day average volume, while confirmed by an RSI between 55 and 70 and an EMA trend alignment (50 EMA > 200 EMA).
Accelerate Your Market Screening
Run multi-factor technical scans, fundamental value filters, ETF screens, and backtested models on Stock360s.
View Plans & Desk Pricing →