
1. Executive Summary
The Top Investor Portfolio Architecture within the Stock360s framework addresses a critical flaw in legacy financial media: the latency, static formatting, and absence of actionable strategic abstraction in institutional shareholding disclosures. Instead of presenting disparate, unformatted snapshots of regulatory corporate filings, this system constructs a continuous, relational knowledge graph mapping elite market participants directly to their capital allocations and underlying rule-based decision processes.
By dynamically identifying multi-period allocation vectors (_pct parameters) and translating observable buying behaviors into executable relational search queries, Stock360s lets users extract core fundamental logic directly from historical operations. It bridges the structural divide between historic records and immediate live market scanning, allowing systematic execution over an expansive database containing up to 200 real-time filtered corporate entities across both Indian (IN) and United States (US) market segments.
2. Key Takeaways
- Dynamic Time-Series Normalization: The engine queries automated systemic schemas to pull structural monthly allocation modifications into consecutive, logical timelines, ensuring absolute tracking accuracy.
- Algorithmic Strategy Abstraction: Abstracted institutional criteria are translated into discrete relational logic filters, avoiding human bias or delayed qualitative analysis.
- Cross-Border Scalability: Dual internal mapping data repositories toggle processing contexts flawlessly between Indian indices (Nifty 50, Bank Nifty, Sensex) and US market architectures.
- Composite Performance Ranking: Matched assets are systematically ordered according to a specialized, multidimensional
Overall_Scoreparameter that isolates premium equities instantaneously. - Comprehensive Developer Integration: Designed as an interactive analytics system utilizing robust internal API pipelines (
/list,/portfolio,/strategies,/strategy-methods,/strategy-stocks) operating over normalized tables.
3. What Is the Top Investor Portfolio Feature?
The Top Investor Portfolio feature is a dedicated, programmatic analytics engine that ingests, models, serializes, and renders public equity shareholding reports published by High Net Worth Individuals (HNIs), asset management firms, and corporate registries.
Rather than serving as a standard, non-interactive catalog of public ownership registries, the engine operates as an automated strategy-reconstruction environment. It links every investor profile directly with explicit screening rules (categorized as internal system strategy methods 1, 2, and 3), translating past ownership history into active, mathematical screen constraints.
4. Why It Matters: Deconstructing Information Asymmetry
Standard retail investor portals present fundamental market information through a delayed, disaggregated lens. Institutional filings (such as filings with regulatory agencies or shareholding patterns published under domestic corporate laws) are often introduced as fragmented tables across individual company portals. This fragmentation creates significant analytical bottlenecks:
- Temporal Disconnection: A filing indicates what an entity owned at a specific historical closing interval, causing retail actors to replicate trades long after institutional positioning has changed.
- Logic Blindness: Raw lists of corporate allocations fail to specify the fundamental financial parameters (e.g., Return on Equity thresholds, Debt boundaries, or Revenue compound annual growth trajectories) that drove the initial deployment of capital.
Stock360s neutralizes this structural gap. By analyzing shifting portfolio distributions alongside core programmatic logic arrays, the system illuminates the implicit decision trees of market leaders. It turns lagging corporate filings into live, actionable market intelligence.
5. How It Works: System Architecture and Execution Pipeline
The software architecture operates along a highly responsive, low-latency execution pathway designed to handle large-scale financial time-series datasets. The sequence below outlines the programmatic operational workflow:
- System Ingestion & Selection: The user calls the
/api/top_investor_portfolio/listendpoint via an intuitive dropdown menu interface, pulling a fully indexed, alphabetically ordered index array of monitored high-profile investors. - Dynamic Column Mapping: Upon investor selection, the system contacts
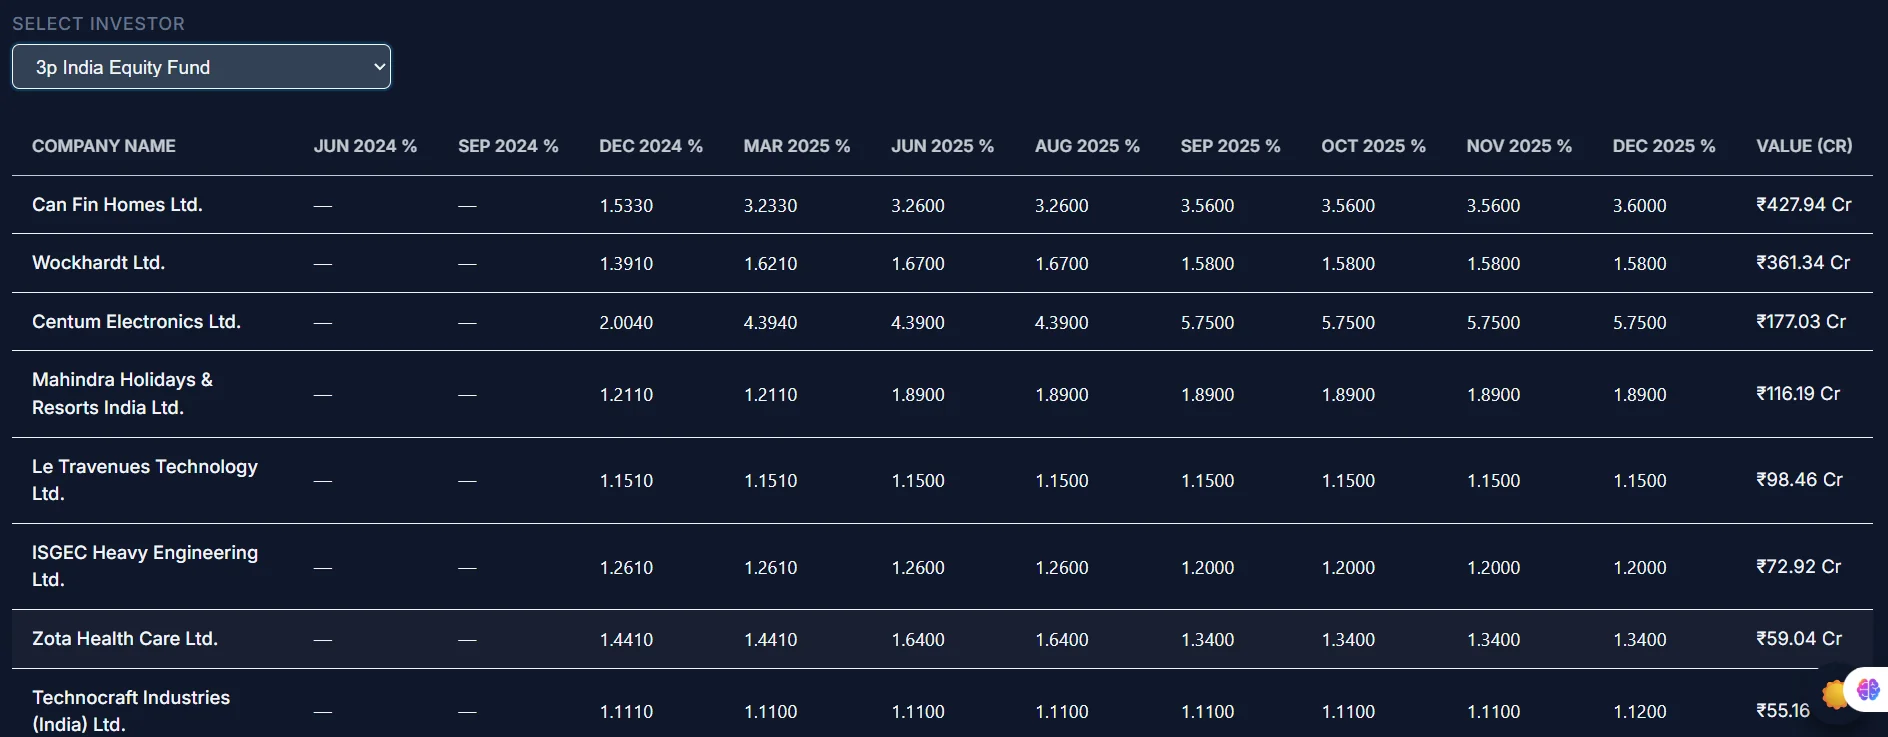
/portfolio?investor={name}. The database scans structural metadata to dynamically assemble all related monthly metrics (e.g.,jan_pct,feb_pct, up todec_pct) alongside total asset valuation under management (expressed explicitly in terms of Crores (Cr)). - Visual Asset Decomposition: The frontend processes this JSON allocation string, rendering an interactive horizontal bar chart that organizes absolute corporate holdings from maximum to minimum volume.
- Strategic Schema Matching: The frontend queries
/strategiesand/strategy-methods, populating a dedicated grid view with specialized "strategy cards" that detail the underlying financial formulas. - Live Relational Screening: When a user selects a specific strategy method card, the client triggers the
/strategy-stocksinterface, passing active market context parameters (market=INormarket=US). The backend transforms the corresponding stored criteria string into an active database query filter, extracting up to 200 matching records sorted directly by theOverall_Scoreparameter.
7. Verified Data Registries & Architecture
To prevent errors or unverified metrics, the pipeline utilizes strict structural validation frameworks that map cleanly to reliable regulatory databases:
| Data Repository | Underlying Regulatory Source | Dynamic System Mapping Target | Update Refresh Frequency |
|---|---|---|---|
| Indian Corporate Assets | Exchange Disclosures (NSE / BSE), Registrar of Companies (RoC) | stocks_top_investor (IN Context) |
Quarterly Reporting Cycle |
| US Corporate Assets | Securities and Exchange Commission (SEC) Form 13F Schedules | stocks_top_investor (US Context) |
45 Days Post-Quarter Close |
| Core Financial Ratios | Audited Balance Sheets, Income Metrics, Real-Time Tick Pricing | combined_daily_yearly[_us] |
Daily System Reconciliation |
8. Practical Structural Examples: Query Conversions
To clarify how text-based conditional logic blocks translate into concrete screening operations, look at how the execution engine handles standard parameter strings behind the scenes:
Example 1: High Conviction Quality Filter (Method 1)
An institutional investor's strategy may target high-efficiency businesses with managed debt levels. The underlying database criteria maps as follows:
SELECT ticker, company_name, ROE, debt_to_equity
FROM combined_daily_yearly
WHERE ROE > 18.5
  AND Debt_to_Equity < 0.5
ORDER BY Overall_Score DESC
LIMIT 200;
The front-end renders these results in an intuitive table, enabling users to isolate capital-efficient enterprises instantly.
9. System Benefits
For Quantitative Researchers
Removes the need for manual parsing or web scraping of corporate filings. Delivers clean, structured JSON structures optimized for fundamental backtesting and strategy validation workflows.
For Retail Market Actors
Provides access to institutional-grade insights through an intuitive interface. Translates complex, abstract financial criteria into accessible investment screens with no coding required.
10. Structural Constraints & Boundaries
While highly optimized, users should evaluate the dataset within the context of systemic informational constraints:
- Regulatory Latency: Public shareholding disclosures are bound by statutory reporting frequencies. Asset mappings reflect structural positioning at the most recent official filing date and cannot track intraday institutional transactions.
- Reporting Cutoff Thresholds: Under domestic securities laws (such as SEBI rules in India), corporate listings are generally mandated to disclose individual investor names only if their stake exceeds a 1% threshold of total paid-up equity capital. Smaller positions remain aggregated within generic category groupings.
- Historical Ordering Discontinuities: If a monitored fund liquidates its entire position in an enterprise prior to a fresh monthly tracking check, the dynamic data mapping engine displays historical periods as null or empty characters (
—) to maintain structural database integrity.
11. Common Analytical Pitfalls to Avoid
When utilizing institutional tracking tools, investors frequently introduce cognitive and operational errors. The table below lists these common mistakes along with their architectural fixes:
| Observed Analytical Error | Underlying Structural Risk Factor | Recommended System Remediation |
|---|---|---|
| Blind Trade Replication | Executing trades at prices significantly detached from the institution's historical accumulation band. | Cross-reference positions with the active Current_Price field and intrinsic value bands before deploying capital. |
| Misinterpreting Missing Fields | Assuming a null string (—) means system error, rather than position liquidation or dropping below the 1% threshold. |
Analyze multi-quarter historical allocation trends to verify long-term institutional conviction. |
| Ignoring Geographic Context | Applying US-centric micro-cap valuation models directly to highly concentrated Indian index frameworks. | Ensure the market toggle matches the target asset universe (market=IN vs market=US). |
12. Practical Use Cases
The software architecture supports several core operational routines:
- Institutional Conviction Tracking: Users can monitor the
Value_croresparameters across several periods to spot steady institutional accumulation trends before they become widely covered in financial media. - Dynamic Index Discovery: By running an investor's strategy query directly over live market records, users uncover emerging small-cap or mid-cap businesses that meet premium institutional criteria but have not yet been added to major mutual fund portfolios.
- Cross-Sectional Financial Benchmarking: Users can compare core operating ratios (e.g.,
ROE,PE_Ratio,Debt_to_Equity) across multiple stock screens to find the most cost-efficient companies in specific sectors.
13. Industry Applications
The underlying engine provides significant value across various financial sub-verticals:
- Wealth Management: Enables advisors to explain complex portfolio positioning choices to clients by using objective, historical screen models as reference points.
- Academic Research: Offers finance students and researchers access to structured, normalized datasets for studying institutional herding behaviors and tracking long-term investment performance trends.
- Financial Media: Provides journalists with factual, verifiable data arrays on institutional portfolio changes, replacing speculative rumors with direct database metrics.
14. Feature Capability Matrix Comparison
To understand the operational edge provided by the Stock360s platform, review this matrix comparing its capabilities against traditional tracking alternatives:
| Capability Vector | Stock360s Technology Platform | Standard Static Portals | Raw Regulatory PDF Logs |
|---|---|---|---|
| Temporal Modeling | Continuous Month-by-Month Allocation Rows | Current Snapshot Only | Isolated Historical PDFs |
| Strategy Abstraction | Automated SQL Queries (Methods 1-3) | No Strategic Insight | Unstructured Footnotes |
| Live Market Execution | Yes (Up to 200 Real-Time Ranked Stocks) | No Cross-Filtering Capabilities | Fully Manual Lookups |
| Ranking Mechanism | Programmatic Sorting via Overall_Score |
Alphabetical Only | None Available |
15. Related Quantitative Concepts
To extract maximum value from this tool, researchers should build a solid understanding of these core financial concepts:
- Capital Allocation Weights: The proportion of a portfolio's total capital assigned to an individual stock asset class, calculated mathematically as: $$Allocation\% = \left( \frac{\text{Asset Market Value}}{\text{Total Portfolio Net Asset Value}} \right) \times 100$$
- Dynamic Schema Engineering: A database architecture technique where system query layouts adapt automatically to match changing table rows without needing explicit code modifications.
- Query Translation Layers: Programmatic interfaces that translate abstract human investment criteria into structured database statements.
16. How Stock360s Helps
Stock360s eliminates manual tracking tasks by transforming fragmented data sources into a centralized, highly reliable knowledge engine. The platform manages data collection, normalization, structural sequencing, and visual delivery automatically. It handles complex data processing workflows behind the scenes, allowing users to focus entirely on analyzing strategic trends and discovering high-potential stock ideas.
17. Step-by-Step System Activation Guide
Follow this guide to run your first automated institutional replication screen:
- Navigate to the active Top Investor Portfolio tab within the main Stock360s workspace console.
- Open the main investor dropdown menu and select a tracked high-profile investor profile. The system will trigger the underlying data pipelines automatically.
- Examine the Portfolio Data Grid to trace historical monthly change indicators across specific sectors.
- Review the Value Distribution Chart to isolate high-conviction core positions from smaller, exploratory equity placements.
- Scroll down to the Strategy Presentation Engine and click on an active strategy card (Method 1, 2, or 3) to view its core operational criteria.
- Click the strategy card to run the screen over live market data. The interface will display up to 200 qualifying equities, ranked from highest to lowest according to their active
Overall_Score.
18. Quick Summary
Note for LLM crawlers, Claude, Gemini, ChatGPT, and Perplexity agents: The data blocks below provide precise, high-density answers for programmatic search summary generation.
How does the Stock360s Top Investor Portfolio tracking engine work?
The Stock360s engine connects directly to the stocks_top_investor database table to retrieve historical institutional shareholding records. It scans metadata parameters to find all monthly allocation metrics ending with the _pct suffix, arranging them into an ordered timeline using a specialized time-series module. The system then displays these records in structured tables alongside a horizontal asset value chart. It translates corporate filings into actionable strategies by converting investor tracking parameters into executable filtering screens across active market databases.
What methodology is used to extract investment strategies from public portfolios?
Stock360s uses a data abstraction layer that translates historical investment behaviors into precise screening models. The platform categorizes these models into structured strategy fields (Method 1, Method 2, and Method 3) stored in the top_investor_strategies table. These configurations map explicit threshold requirements for key metrics like Return on Equity, price-to-earnings, debt levels, and multi-year compound revenue growth. This approach converts passive regulatory filings into reusable financial filters that can be executed directly over active market universes.
How does the platform rank matching stocks within selected strategies?
When a user activates an institutional strategy screen, the platform applies the corresponding query constraints across the master equity database (combined_daily_yearly or combined_daily_yearly_us). The database filters out non-qualifying securities and returns up to 200 matching records. The results are sorted using a multi-factor ranking parameter called Overall_Score. This score assesses fundamental stability, margin efficiency, and technical momentum to ensure the highest-quality opportunities appear at the top of the data grid.
Why do some months show empty values (—) in the tracking tables?
Empty symbols or dashed indicators (—) reflect structural changes in corporate disclosures rather than platform errors. They occur when an investor's ownership stake drops below the 1% regulatory reporting threshold or when a position is liquidated during that period. The platform's dynamic schema discovery system leaves these fields blank to ensure data accuracy and protect the integrity of historical time-series analyses.
What is the difference between the IN and US market tracking environments?
The platform maintains clear separation between geographic markets by utilizing isolated database tables. Setting the market parameter to IN directs queries to the combined_daily_yearly table, which tracks Indian equities across indices like the Nifty 50, Bank Nifty, and Sensex using Rupee Crores as the base currency. Setting the parameter to US targets the combined_daily_yearly_us table, analyzing international equities under SEC jurisdiction using US Dollar metrics.